Handwriting Digit Detector
Vaishnavi Vednere (vv228) & Vayun Tiwari (vt252)
A memory-optimized CNN running on the RP2040 microcontroller classifies handwritten digits drawn on a resistive touchscreen, showcasing real-time inference despite stringent memory constraints.
Introduction
The core of this project revolves around deploying a Convolutional Neural Network (CNN) on the RP2040 microcontroller to classify handwritten digits. The CNN is structured with quantized 8-bit integer weights and activations to fit within the limited RAM of the RP2040 while maintaining a reasonable inference speed. Input data is collected via a resistive touchscreen, which functions as a crude drawing interface. The touchscreen readings are processed and mapped into a 28x28 pixel grid, which serves as input to the CNN. After classification, the predicted digit is displayed on an OLED screen, providing immediate feedback to the user.
upload video to youtube & embed
High Level Design
Rationale
Over the course of the semester, we found Lab 2: Digital Galton Board to be the most compelling project. This lab pushed the memory limits of the RP2040 by requiring extensive optimization to fit a complex physics simulation within the microcontroller’s limited RAM memory. We managed to incorporate as many simulated balls as possible, optimizing both data structures and code implementation. This experience inspired us to further explore the RP2040’s capabilities under stringent memory constraints, leading to the idea of implementing TinyML on the same hardware platform. Given that machine learning models are traditionally memory-intensive, we aimed to investigate how effectively we could fit a functional CNN onto the RP2040 while maintaining real-time inference performance. This challenge of pushing the RP2040’s limits formed the core motivation for our final project.
Background
Resistive touchscreen
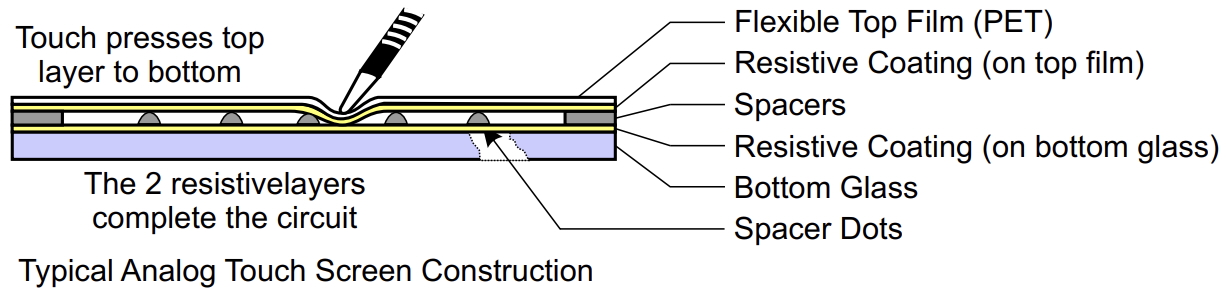
The input to the CNN is taken in from a resistive touchscreen. A resistive touchscreen operates based on the principles of a voltage divider network formed by two conductive layers separated by a small gap. When a user applies pressure to the touchscreen surface, the two conductive layers make contact, creating a variable resistor network. By selectively configuring certain pins as inputs and outputs, we can effectively measure the X and Y coordinates of the touch event.
In this project, we began by using a baseline demo code provided by Professor Hunter Adams, which was designed to map the touchscreen readings to VGA output. This code serves as a foundational structure for our data acquisition process.
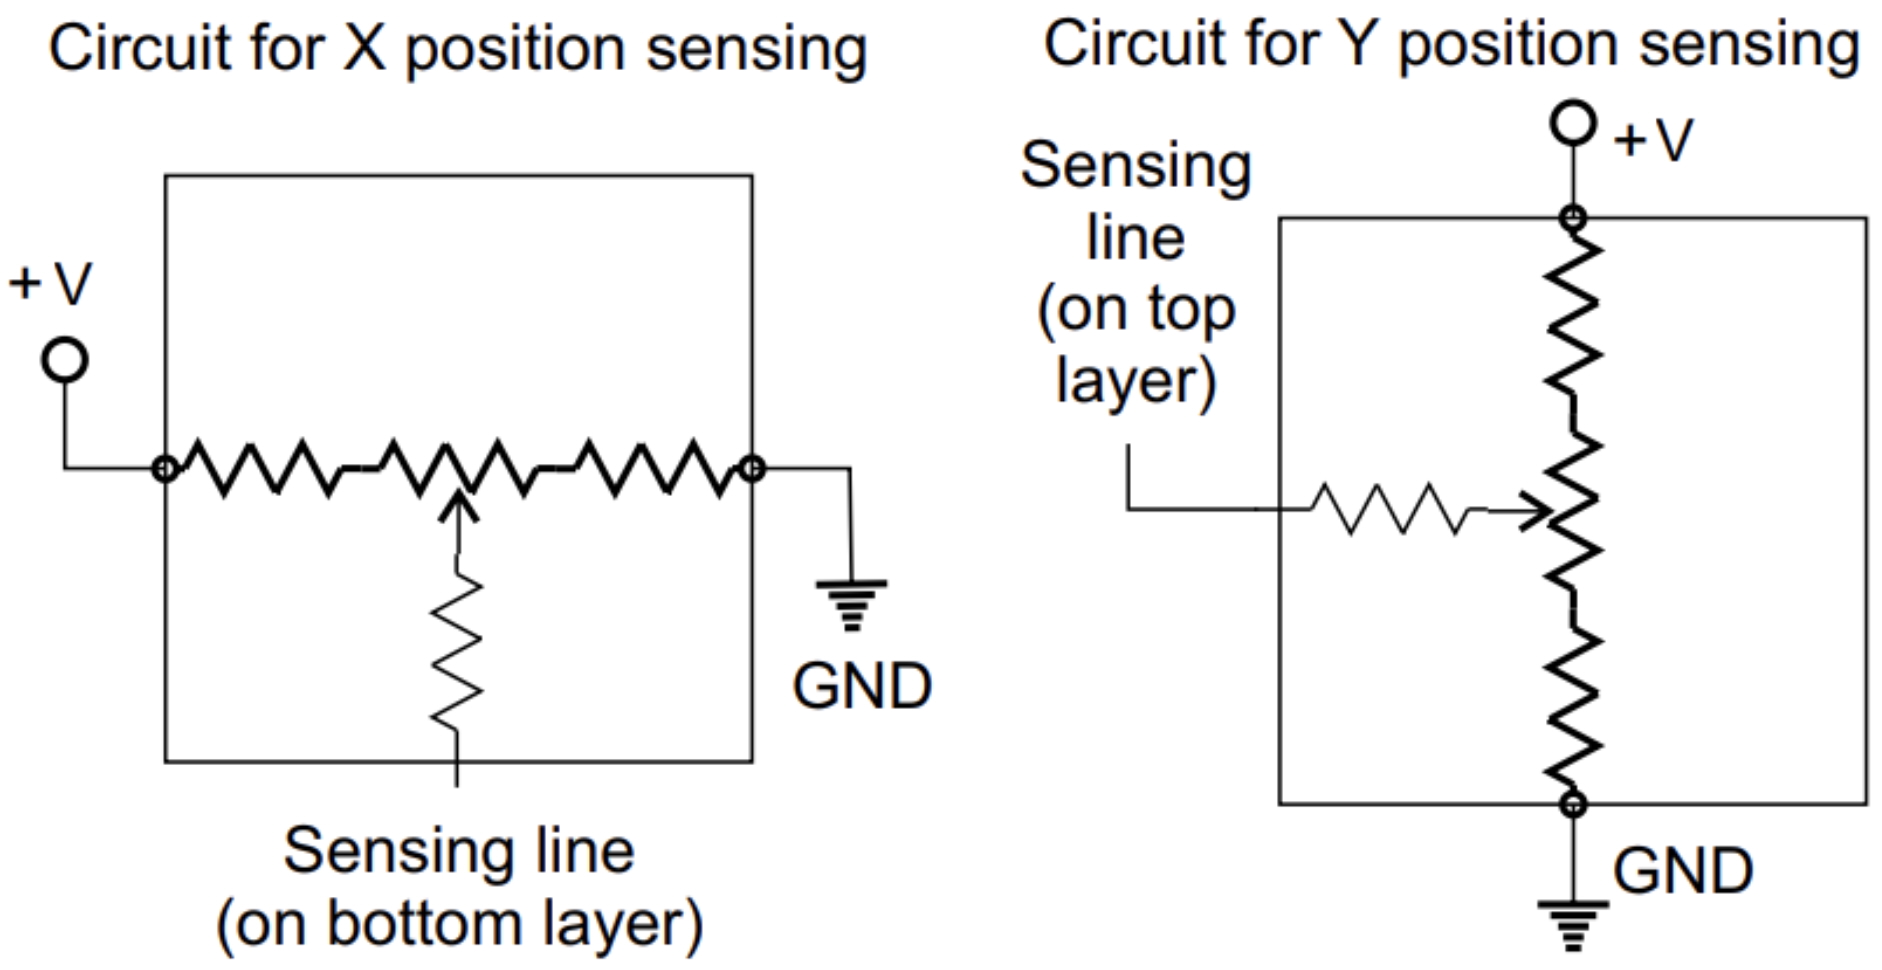
The resistive touchscreen consists of four terminals: X+, X-, Y+, Y-. To accurately read both X and Y coordinates, we alternate between two pin configurations:
- Reading the Y Coordinate:
- The X+ and X- pins are configured as outputs, set to
HIGHandLOWrespectively, forming a voltage divider network along the X-axis. - The Y+ and Y- pins are configured as inputs, allowing the ADC to sample the Y-axis voltage based on the current X-axis configuration.
- The X+ and X- pins are configured as outputs, set to
- Reading the X Coordinate:
- The Y+ and Y- pins are configured as outputs, set to
HIGHandLOWrespectively, forming a voltage divider network along the Y-axis. - The X+ and X- pins are configured as inputs, allowing the ADC to sample the X-axis voltage based on the current Y-axis configuration.
- The Y+ and Y- pins are configured as outputs, set to
Analog-Digital Converter: The RP2040’s ADC module is a 12-bit successive approximation ADC that reads voltages
ranging from 0V to 3.3V and converts them to a 12-bit integer value. In our implementation,
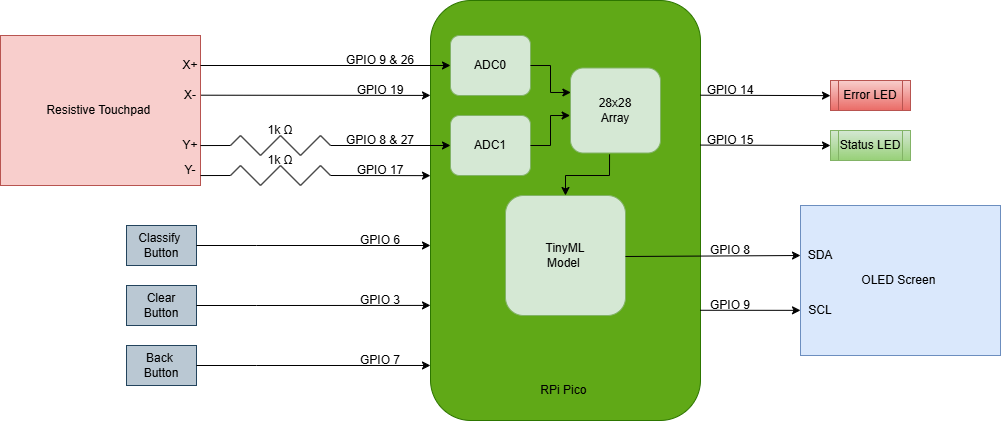
we read the X and Y voltages by configuring the ADC to sample from GPIO pins GP26: ADC0 and GP27: ADC1.
To mitigate noise and provide a more stable reading, a simple low-pass filter is implemented
using a 16-sample buffer. The raw ADC readings for each axis are accumulated and averaged to provide a smoothed output. This averaging is extremely important for stabilizing
the output values, given that the resistive touchscreen readings fluctuate due to contact resistance variability. The details and challenges of our resistive touchscreen implementation are expanded upon in Hardware Design.
Timer Interrupt Service Routine: To constantly sample the current position on the resistive touchscreen, a timer interrupt service routine (ISR) runs at a fixed 250Hz frequency, toggling between the X and Y measurement modes. This sampling rate was specifically chosen to ensure that X and Y readings were not coupled, while also allowing rapid touch events to be accurately captured and processed. The ISR performs the following steps:
- Switch to the next measurement mode (X or Y).
- Read the ADC value for the current axis.
- Update the 16-sample buffer.
- Compute the average value and store it as the current coordinate reading.
This methodology effectively decouples the sampling process from the main application logic, allowing the touchscreen data acquisition to run independently without blocking the primary control loop. This ensures that even during classification or display operations, the touchscreen data acquisition continues uninterrupted, maintaining consistent data availability. The final scaled X, Y values are mapped to a 28x28 grid, serving as input data to the CNN model.
Convolutional Neural Network
The CNN model was developed and trained in Python using the TensorFlow library. The training dataset used was the MNIST dataset, a widely recognized dataset of 28x28 grayscale images representing handwritten digits ranging from 0 to 9. The goal was to train a lightweight, memory-efficient CNN model that could be quantized and deployed to the RP2040 microcontroller without exceeding its limited RAM capacity.
Dataset Preperation: The dataset utilized for training the CNN model was the MNIST dataset, which consists of 60,000 training images and 10,000 testing images of handwritten digits ranging from 0 to 9. Each image is a grayscale 28x28 pixel matrix.
The dataset was imported using TensorFlow’s built-in mnist.load_data() function, which returns both the training and testing datasets as (x_train, y_train) and (x_test, y_test)
tuples. These datasets contain the raw pixel values in the range [0, 255].
Since the CNN expects a 4D tensor input (batch_size, height, width, channels), the images were reshaped to include a single channel dimension to indicate that the images are grayscale.
Model Architecture: The model consists of a series of convolutional and max-pooling layers to extract spatial features from the 28x28 input images. The initial convolutional layers utilize small 3x3 kernels to capture fine-grained edge and texture information, followed by max-pooling to reduce spatial dimensions and retain key features. A fully connected dense layer aggregates the extracted features, and a final dense layer with softmax activation outputs the classification probabilities for each of the ten digit classes.
| Layer | Function | Input Shape | Output Shape |
Conv2D |
Extracts low-level features (edges, corners). Helps identify basic shapes in the digit input. | (1, 28, 28, 1) | (1, 26, 26, 8) |
MaxPooling2D |
Reduces spatial dimensions, downsampling to keep the RP2040’s RAM use low. Provides translation invariance, important for touchscreen inputs. | (1, 26, 26, 8) | (1, 13, 13, 8) |
Conv2D |
Extracts higher-level features. Adds additional filters to detect more complex patterns in the digit strokes. | (1, 13, 13, 8) | (1, 11, 11, 16) |
MaxPooling2D |
Further reduces spatial dimensions and enhances robustness to spatial variations. | (1, 11, 11, 16) | (1, 5, 5, 16) |
Flatten |
Converts 3D feature maps to a 1D vector for the dense layers. Prepares data for classification. | (1, 5, 5, 16) | (1, 400) |
Dense |
Fully connected layer that aggregates spatial features into meaningful patterns for classification. ReLU keeps activations sparse, lowering MAC count during inference. | (1, 400) | (1, 64) |
Dense |
Output layer with softmax activation, providing classification probabilities for each digit (0-9). | (1, 64) | (1, 10) |
Before quantization, the total model occupies 107.6 KB of memory.
Training and Evaluation: The model was compiled using the Adam optimizer and trained for 5 epochs using a sparse categorical cross-entropy loss function. The training accuracy improved steadily across epochs, achieving a final accuracy of approximately 98.9% on the test dataset.
Quantization and TFLite: After training, the model was converted to TensorFlow Lite format for deployment on the RP2040. The conversion included full integer quantization to reduce model size and memory footprint to 56 KB.
The choice of model architecture, along with how it interfaces with the RP2040 is further explained in Software Design.
Logical Structure
The system is structured as a three-stage pipeline consisting of data acquisition, processing, and inference.
- Data Acquisition: The resistive touchscreen is sampled at a fixed frequency using a timer ISR. The ISR captures X and Y coordinates alternately, filters the data using a 16-sample averaging buffer, and maps the coordinates to a 28x28 pixel grid.
- Data Processing: The pixel grid is preprocessed to ensure consistency in scaling and orientation. Preprocessing also involves padding the drawn image with grey pixels to create a thicker stroke for better edge detection. The 28x28 grid is then fed to the CNN.
- Inference: The CNN processes the input data and outputs a probability vector of ten values, each representing a predicted digit (0-9). The highest probability class is selected and displayed on the OLED screen. Additionally, feedback is provided to the user through LED indicators and button-based controls.
Software / Hardware Tradeoffs
The primary hardware trade-off centered around the choice between a resistive touchscreen and a more robust SPI-based touchscreen. The resistive touchscreen was chosen due to its minimal software complexity and straightforward analog interfacing, leveraging the RP2040’s ADC for data acquisition. However, the resistive touchscreen introduced noisy, inconsistent data that required substantial preprocessing and a deeper neural network to handle variability in input. In contrast, an SPI touchscreen would have provided cleaner data and potentially allowed for a simpler neural network, but at the cost of integrating large SPI drivers that could overwhelm the RP2040’s memory capacity. We had first planned to use a SPI touchscreen, specifically, the XPT2046, yet due to incompatabilities and difficulty setting up the SPI driver, we opted for the resistive touchscreen, keeping the focus of the software on the CNN instead of sensors.
On the software side, we balanced model complexity against memory usage, opting for a compact CNN architecture with quantized 8-bit weights and activations. A deeper, more complex model could have potentially increased classification accuracy but would have exceeded the RP2040’s limited memory constraints. The model structures we experimented with, mainly consisted of two convolutional layers and two fully connected layers, and was optimized to fit within the available memory while still maintaining acceptable accuracy for handwritten digit classification. We experimented with convolution kernel sizes, number of filters, and different layers in between, such as max pooling. TensorFlow Lite Micro was employed for inference, allowing for memory-efficient tensor operations and integer quantization, further minimizing RAM usage.
Existing IP considerations
This project relies on several open-source libraries and codebases to implement the CNN model and touchscreen interface. The primary components include TensorFlow Lite Micro (TFLite Micro), which is released under the Apache 2.0 license, allowing for modification and redistribution. Additionally, the OLED display driver library (OLED_SSH1106_I2C) is public domain, and the touchscreen framework is based on Hunter Adams' Resistive Touchscreen demo, which is publicly accessible for educational purposes.
There are no specific patents associated with the CNN model architecture, as it is based on common deep learning principles. However, integrating machine learning models onto microcontrollers is an area of ongoing research and commercial interest, with various proprietary frameworks existing for similar implementations. To avoid potential conflicts, only open-source, publicly documented resources were utilized throughout the project.
The machine learning framework (TensorFlow Lite Micro) and OLED library are public domain resources. Professor Hunter Adams' Resistive Touchscreen demo provided a foundational structure for touchscreen data acquisition.
Program Design
Hardware Design
Components
There are a few hardware components required for this project, including a touch screen, a display screen, and external buttons. The components and their datasheets are listed in the table below.
| Component | Functionality |
| Raspberry Pi Pico | Main microcontroller for project |
| Resistive Touchscreen | Used for touch input |
| SSD1306 OLED Screen | Used to display classified numbers |
| 1k Ω Resistors (2pcs) | Used to equalize touchscreen resistance along X and Y |
| LEDs (2pcs) | To indicate when classifying mode (green LED), or if error (red LED) |
| Buttons (3pcs) | Used to initiate classification from resistive touchscreen input, clearing the OLED screen, and backspace one digit from the OLED screen |
| PCB (optional) | Provides easily portable project (schematic below) |
| Lithium Ion Battery (optional) | Allows project to be powered without the user's computer, increases portability |
Details
Resistive Touchscreen: As stated above, we began by using a baseline demo code provided by Professor Hunter Adams, which was designed to map the touchscreen readings to VGA output. This demo served as a good basis to begin reading the touchscreen's voltage divider input, but we had a few challenges before we could read in a sensible input.
- Different Resistance across X and Y axis of touchscreen: On the touchscreen's datasheet, it is noted that the Y axis has a resistance of 200 - 1000Ω, while the X axis has a resistance of 100-600Ω.
This makes sense, as the X dimension of the screen is shorter than the Y, but this low resistance would saturate the ADC value at 3.3V, no matter where on the screen we pressed.
Essentially, the issue is that to read the X position, we are driving Y with only the small, built-in X axis resistance, which is overloading the thin ITO film. In the worst case:
which is a huge current for a thin ITO film. It causes the touchscreen to behave like a short circuit across X+ and X- when pressed, so the ADC sees an immediate collapse to VDD instead of normal resistive divider behavior.
$$ I = \frac{3.3V}{100\Omega} \approx 33mA $$
We decided the solution to this would be to add resistors in series between the Y+ and Y- pins of the touchscreen and their respective GPIOs. After iterative tuning, we settled on 1k Ω resistors in series for both paths. Now, when driving Y+ and Y- to read the X position, the current into the film is limited, a proper voltage divider is formed, and the ADC reads behave correctly. However, because of the lowered drive while reading X, the range of raw ADC values was significantly tighter than the range for Y values. We added a small (100 nF) decoupling capacitor between the ADC GPIO and ground to decrease signal noise so that our X readings would have less random variation.
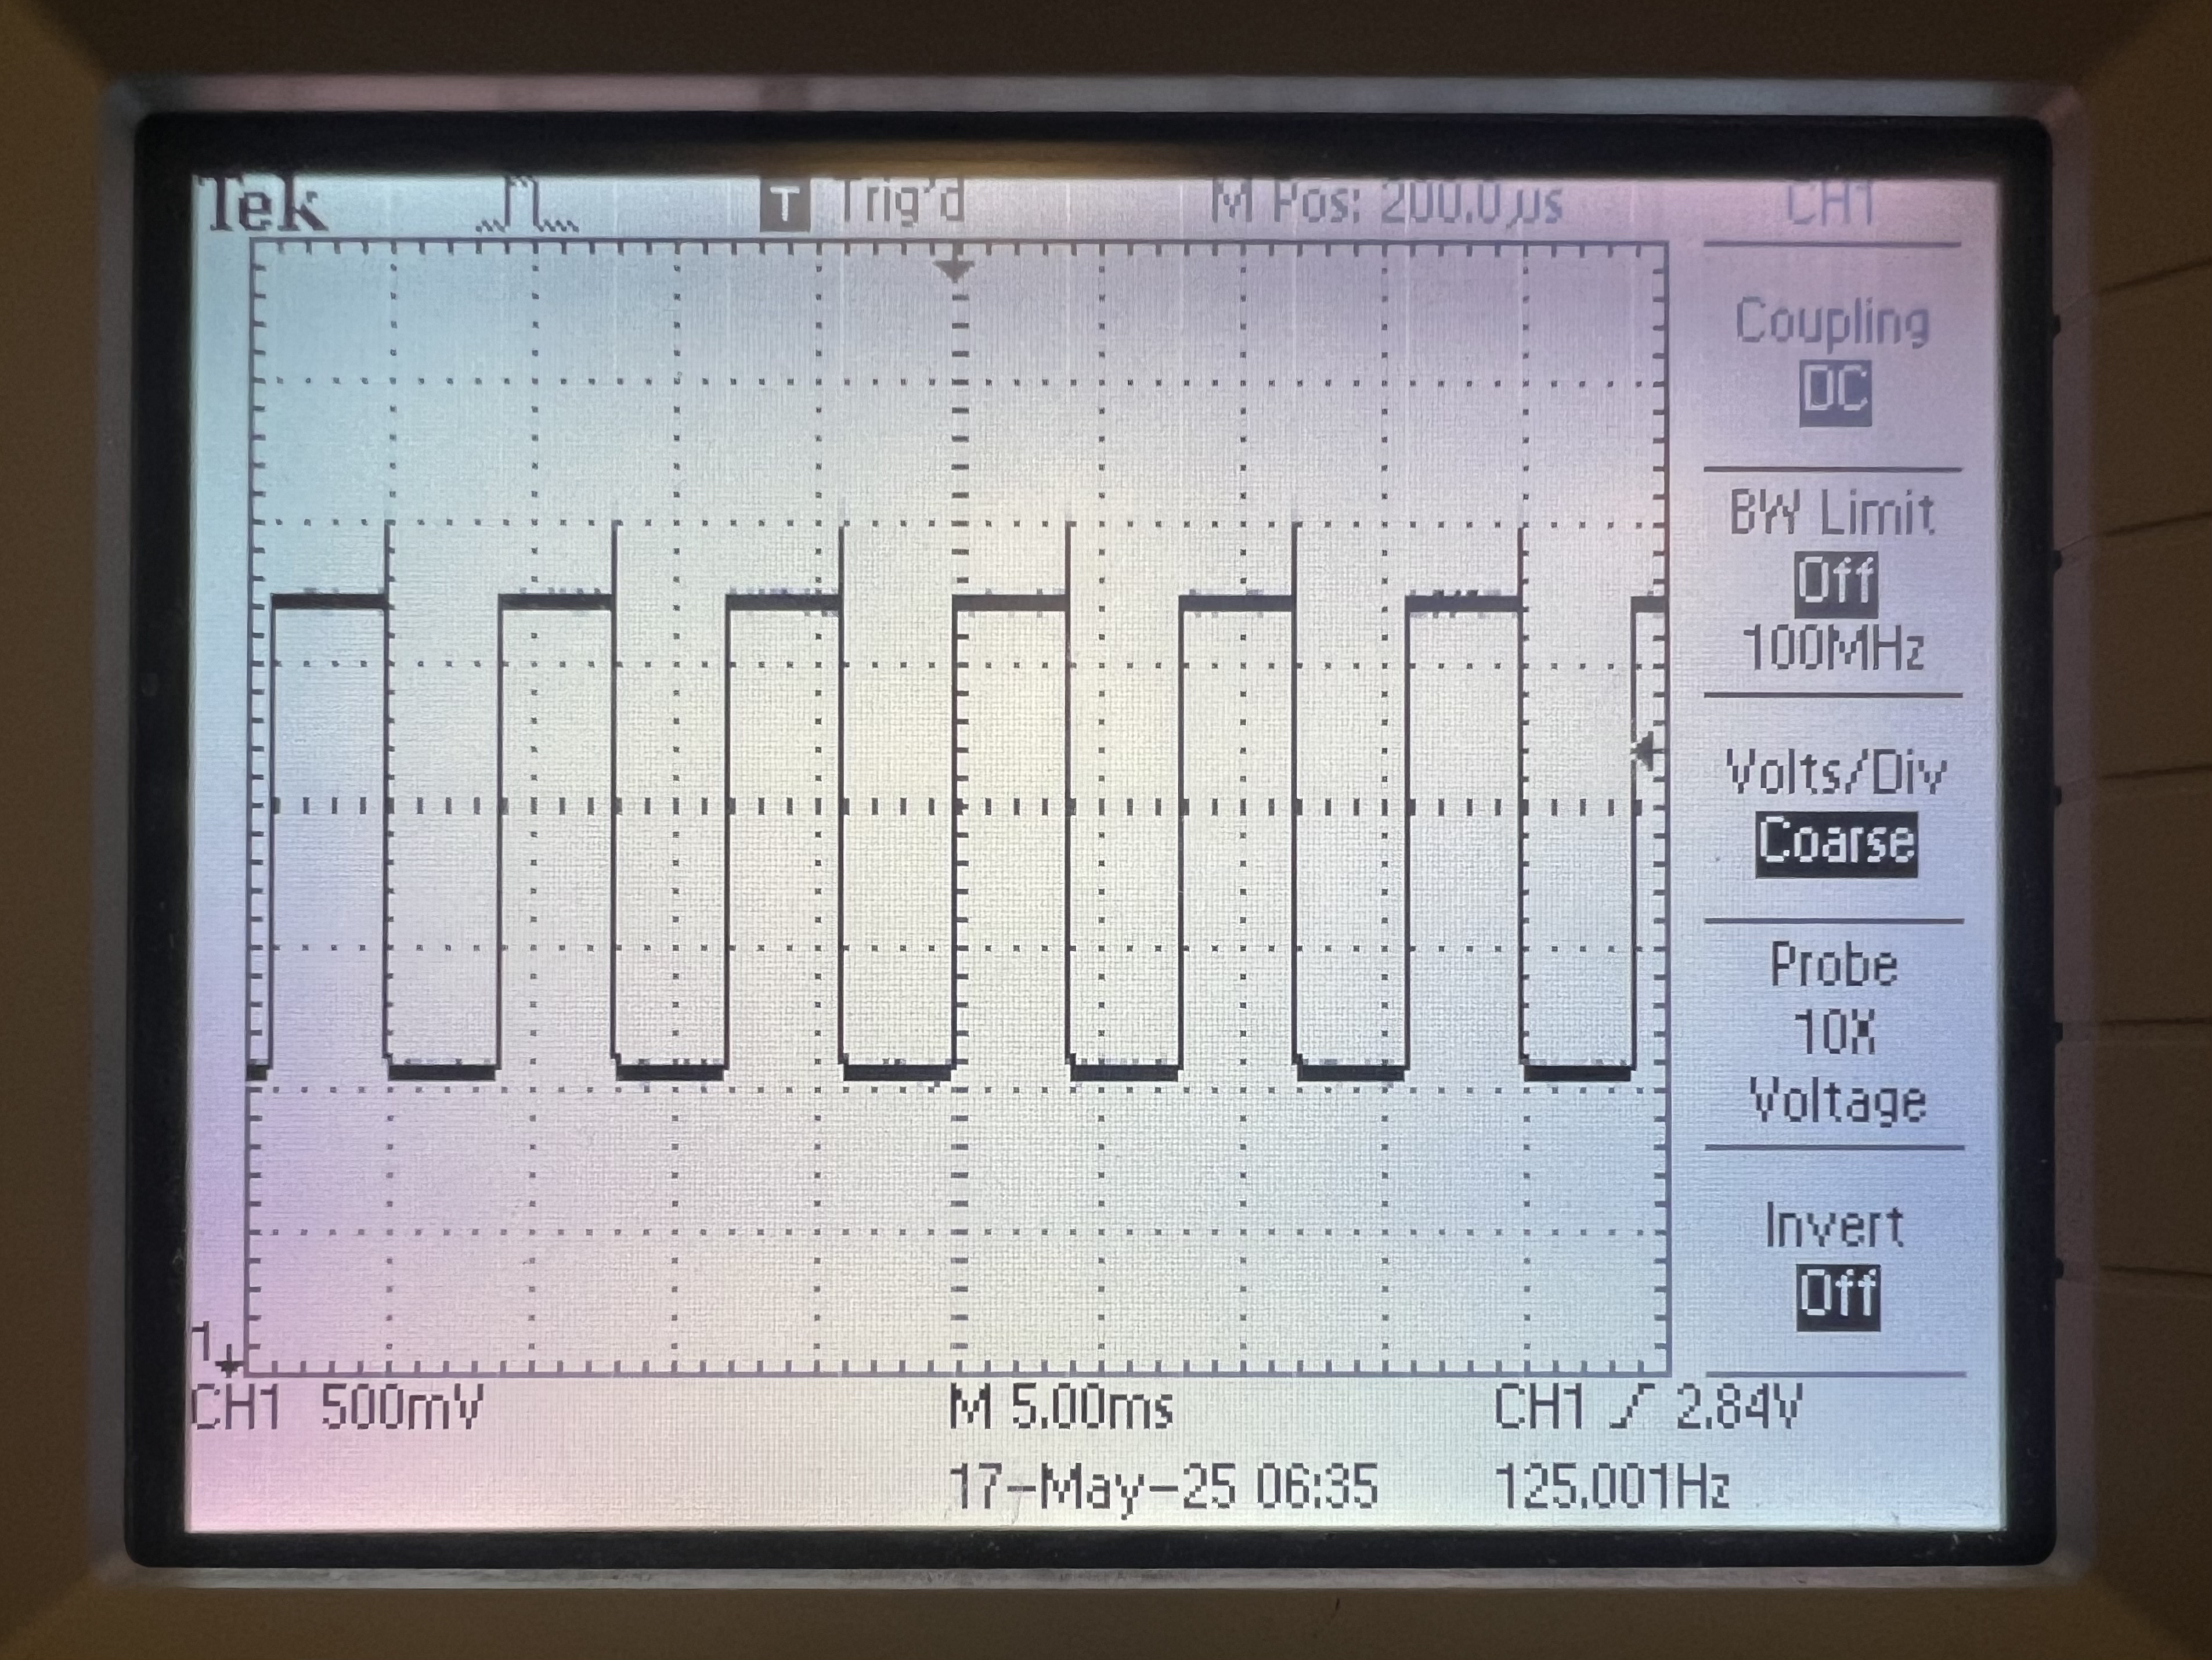
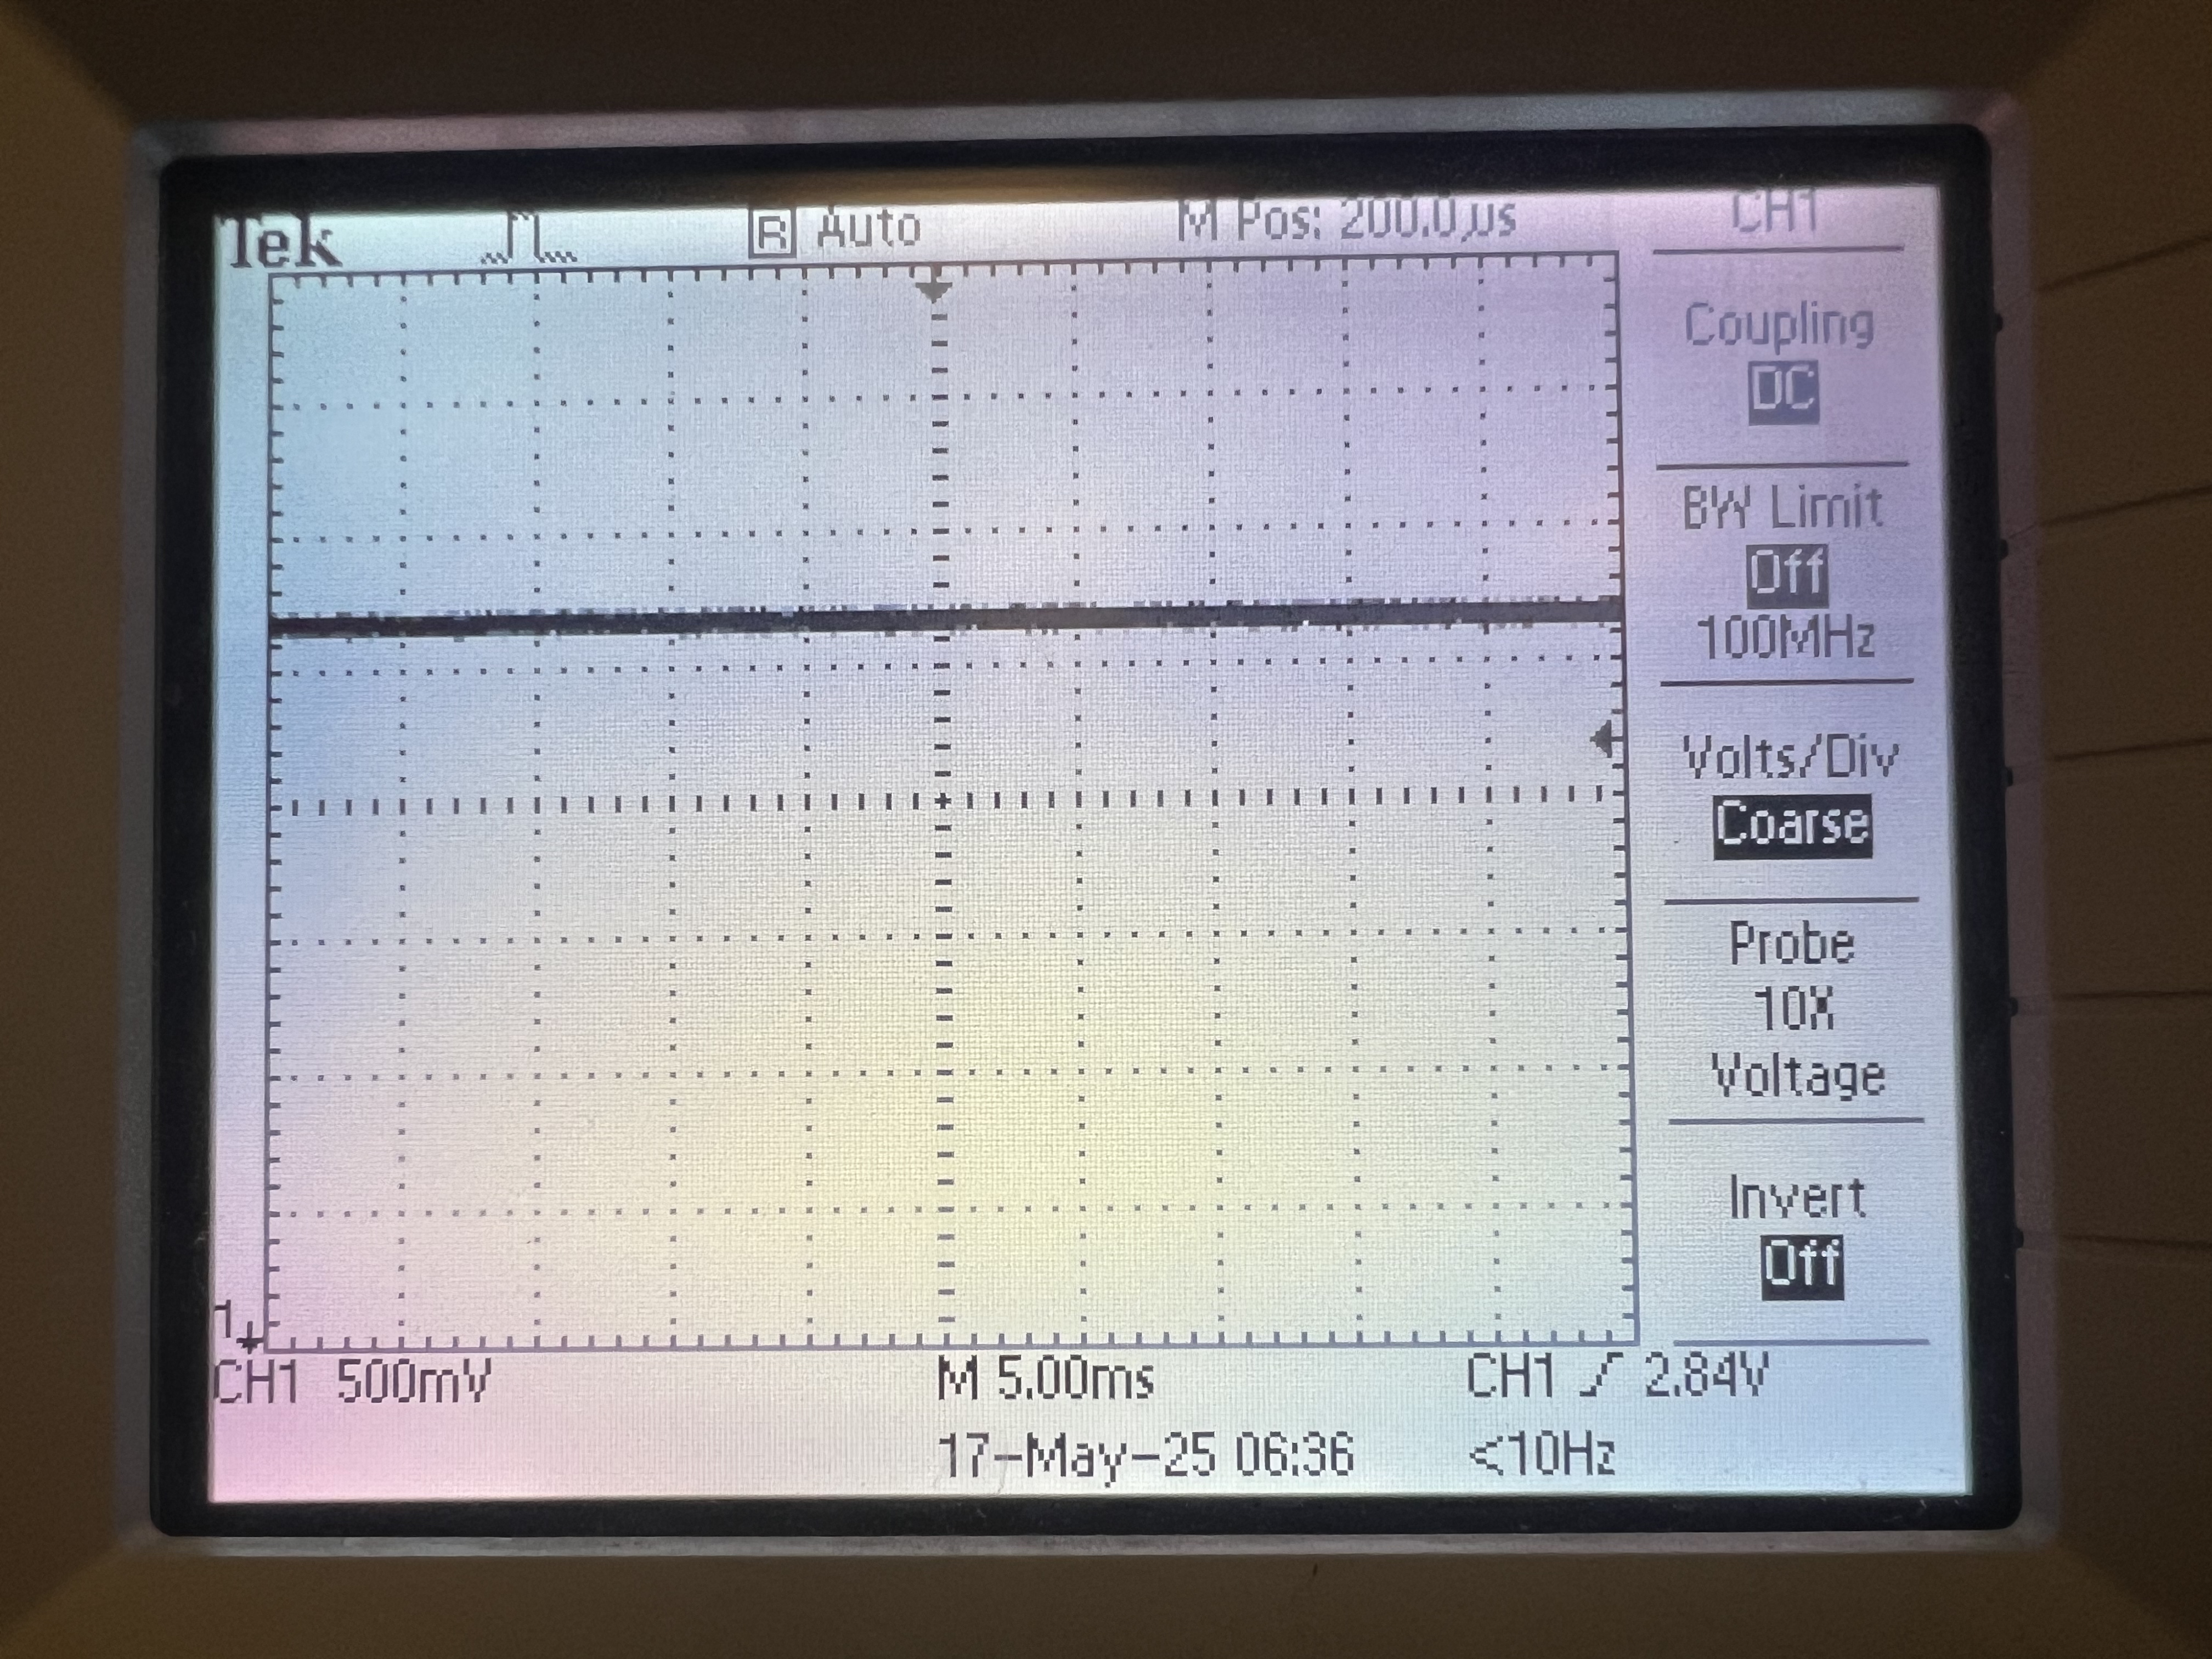
Oscilloscope reading ADC with no touch applied
Incorrect operation: oscilloscope reading ADC with touch applied before adding 1k Ω series resistors ADC value saturates immediately
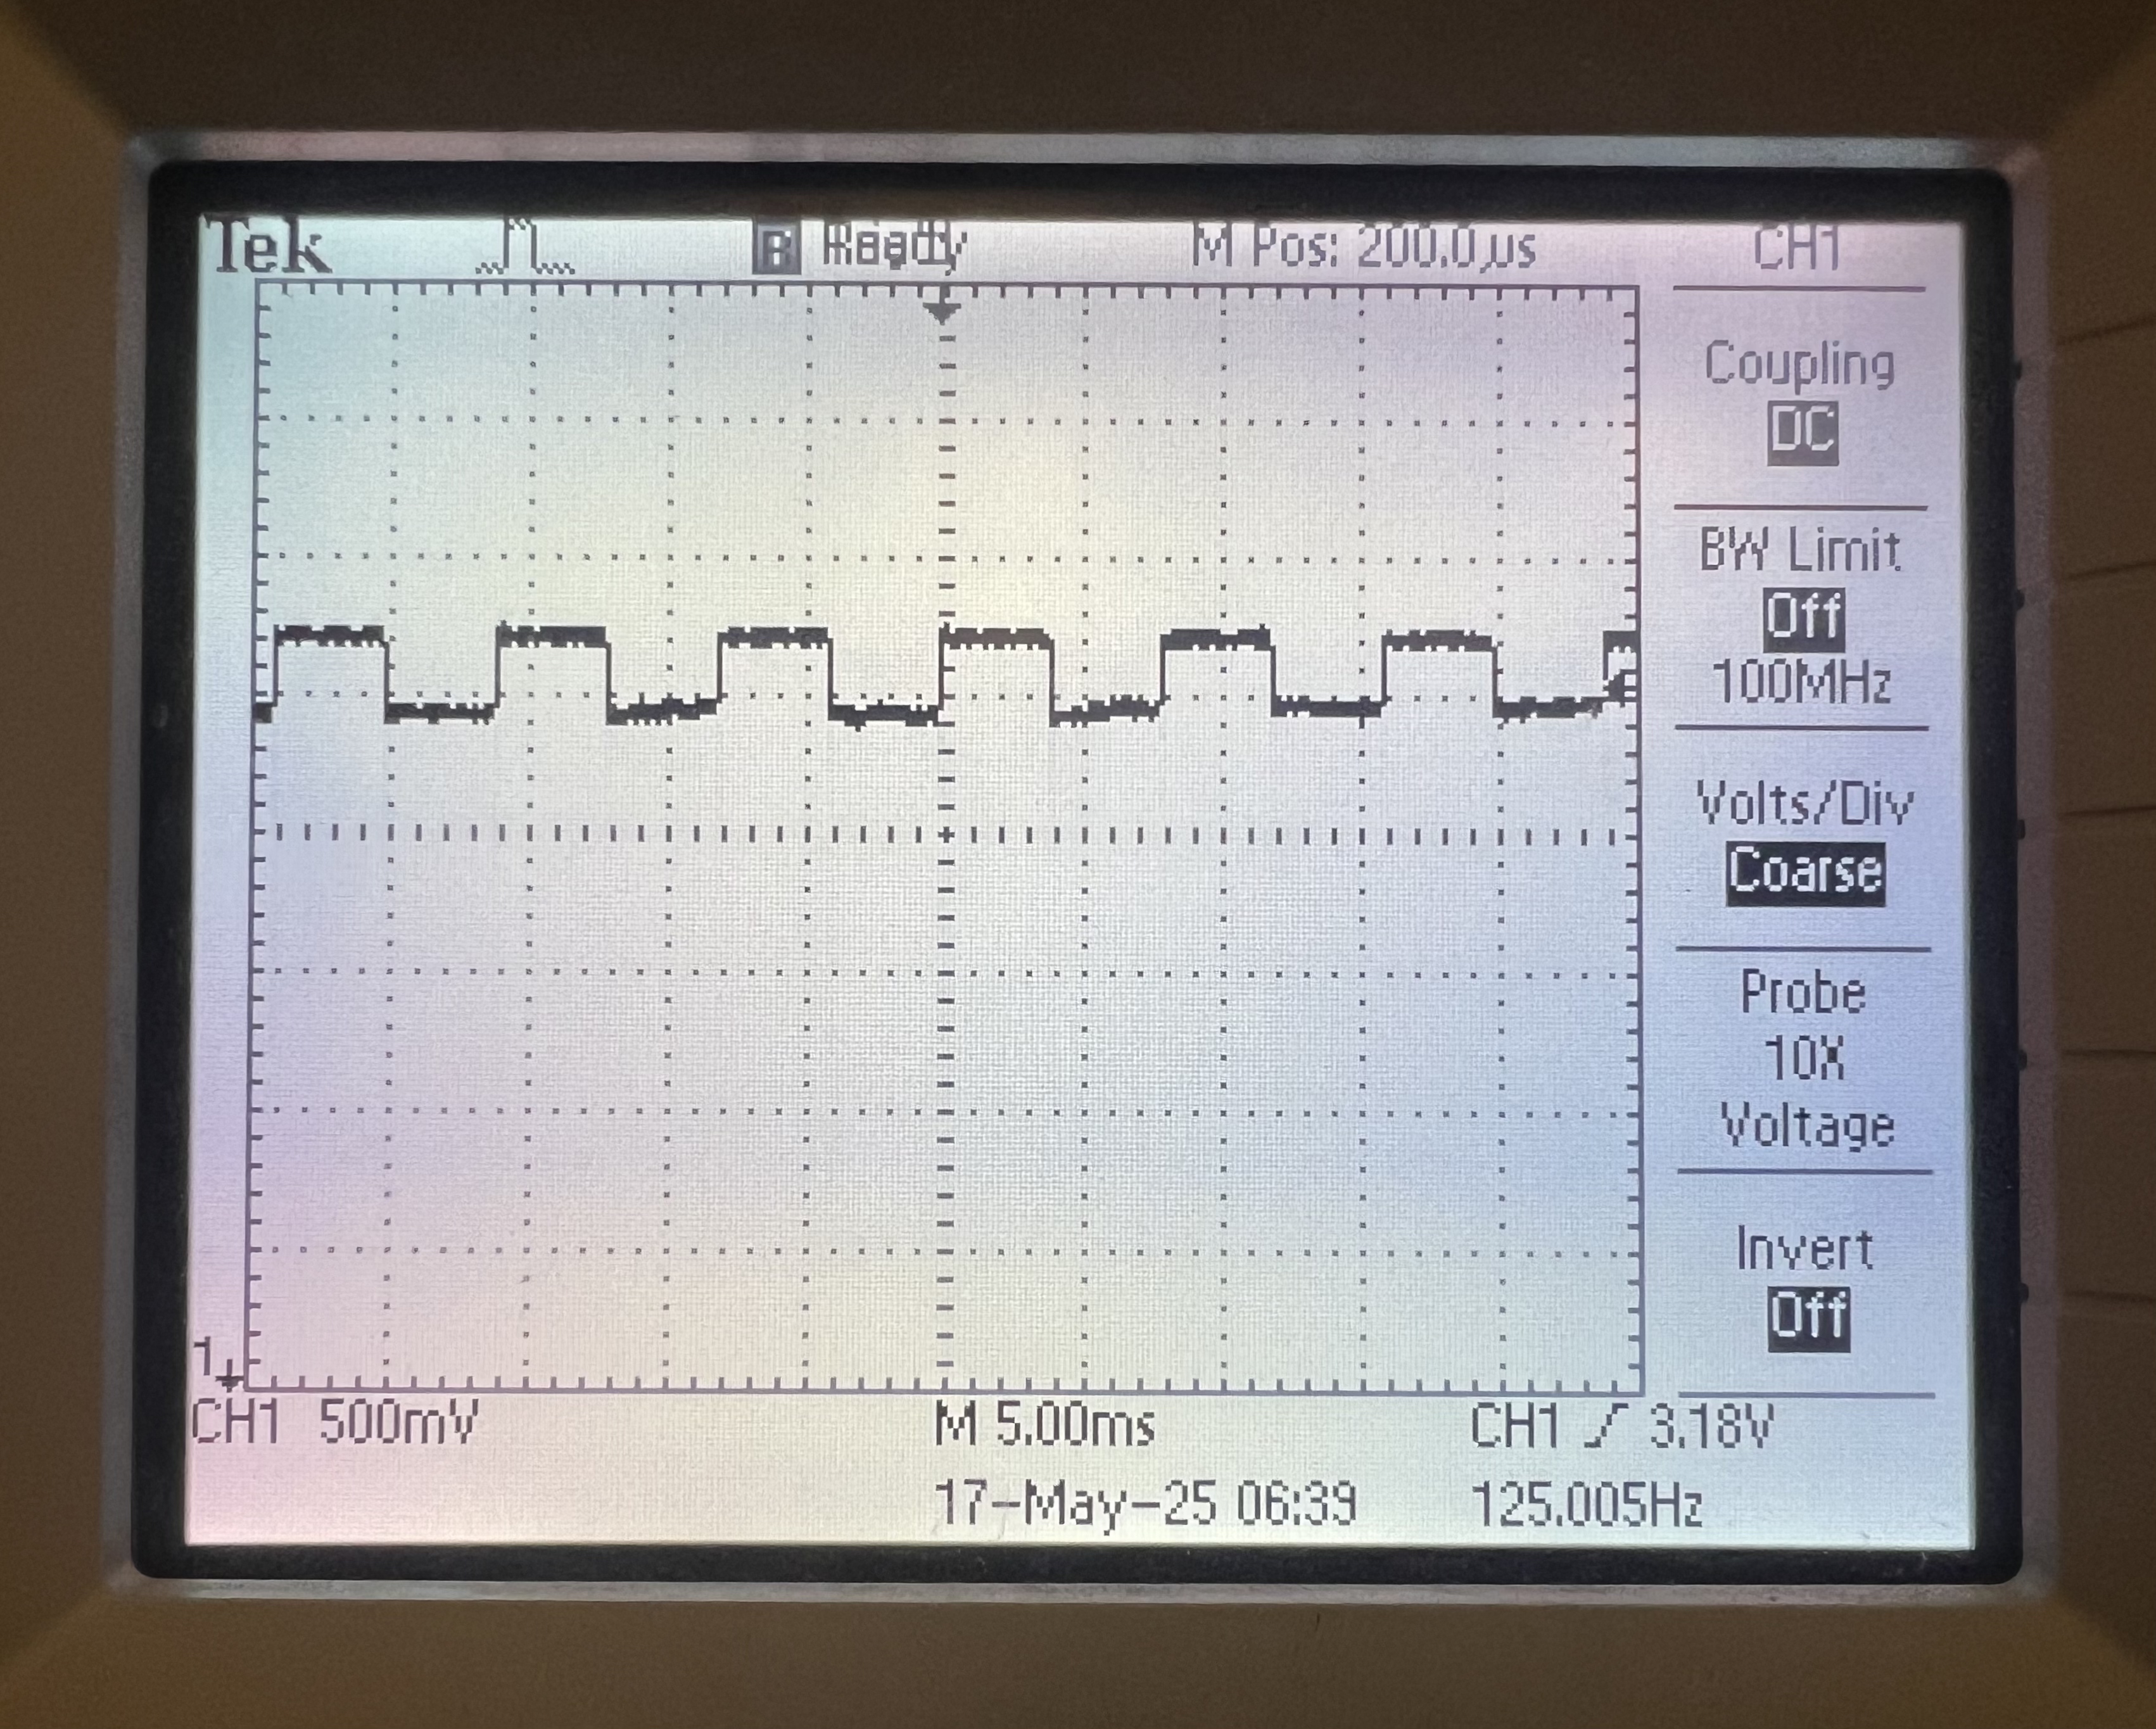
Correct operation: oscilloscope reading ADC with touch applied after adding 1k Ω series resistors ADC value remains high, but does not full saturate - Capacitive Coupling: Physically, the X and Y sheets are separated by a thin insulator (~micron distance).
When you drive Y (Y+ = 3.3V, Y- = 0V), and leave X floating, the floating X layer
picks up voltage through capacitive coupling and resistive leakage. If X floats to some voltage,
it modulates the local potential on the Y sheet where you are pressing, which is picked up by the ADC. When pressing, the ADC readings would 'drift.'
To combat this issue, we had two fixes that both revolved around the speed of reading the ADC. First, we added two 'fake' ADC reads. For example, to read the X position:
                    setupX();

                    adc_select_input(0);

                    adc_read();

                    adc_read();

                    adc_x_raw = adc_read();
we setup the X+, X-, Y+, Y- GPIOs as explained above, then select the ADC corresponding to X. We next call
adc_read();twice without actually saving the read to allow the ADC reading to settle, before saving the read.The next fix was simply to slow down the frequency of the timer ISR. Professor Hunter Adam's code had the ISR runnning at 2000Hz, but even with the fake ADC reads, we were still getting drift. We decided to slow this down to 250Hz, which is a significant change, but this still allowed for relatively rapid touch events to be accurately captured and processed. How this choice impacts user usage are further explained below.
Hardware Challenges
One key hardware component that we faced a number of issues with was the resistive touchscreen. The initial touchscreen that we purchased was the ILI9341 which was paired with the XPT 2046, which is an SPI device. There were SPI drivers online for various different controllers such as the ESP-32 and Arduino. We spent a day trying to port over these libraries, but decided it would not be worth the time, as we ran into a number of compilation issues. We also attempted to use the e_SPI driver library online, however, this seemed to be more oriented towards using the LCD screen, whereas we were interested in the touchscreen functionality mainly. It was considerably easier to work directly with the raw analog values from the resistive touchscreen, which was an X voltage and a Y voltage, but required four terminals (X+, X-, Y+,Y-) to be set up carefully, such that the X and Y voltages would output the correct values. The setup used can be found in the function table above. To obtain the X and Y outputs, we exposed the traces on the ILI module, as shown below. This successfully enabled us to read X and Y presses, however the scale of output values was not as expected. At this point, we had purchased a backup touch interface, namely the 3.7’’ touchscreen from Adafruit. The scale of these output values was also off, almost indicating a diagonal calibration. This hinted that something was uneven with the X and Y axes, but we were not sure what. The fix for this required additional hardware components, explained in the Resistive touchscreen section above. To verify functionality of the touch screen, we hooked up the output X and Y to an oscilloscope. (Either X+ or X- can be the output terminal, it solely depends on the setup function.) Connecting the touchscreen to the scope revealed a important insights, which likely explained why we were seeing incorrect numerical output from the touchscreen.
The final issue was a broken pin on the Pico. Initially, we were almost certain this could not be the issue. This pin was being used as an input from the CLEAR button and we tried various methods for clearing the screen, none of which worked. We initially thought it was a code issue, but as learned in lab 3, we shortly decided to check the hardware. We checked the functionality of the button with a multimeter by checking if the terminals of the button shorted together when the button was pressed. This proved button functionality. We then probed the voltage output of the pin, which was 0V, despite setting a pull-up resistor to that pin. This was the indicator that something was wrong with the pin, as both of the other button pins were correctly outputting 3.3V. We ultimately had to hardwire the button to a different GPIO pin and cut the trace from the CLEAR button to the PICO, such that the button would not be grounded.
Hardware Tips & Recomendations
Purchase backups: We ripped the FPC Connector the day before the final demo, and luckily we had ordered two to begin with.
Verify online libraries before purchasing components: Even if it may seem as though there are libraries that work online, it is worth the time to import it onto your local system and check that you are able to write a sample program, compile it, and upload it to Pico.
Use the oscilloscope rather than debug output: Although debug output can be helpful when programming, using a scope proves much more fruitful in deciphering what is physically happening with a circuit compared to what is supposed to be happening. It greatly helps with diagnosing issues as well as solving them.
Software Design
The core software design can be split into three sections: trackpad+image processing, classification, and digit display.
Trackpad
When starting the project we first started with the CNN model input: the resistive touchscreen image. We cloned Professor Hunter Adam's Resistive_Touchscreen_Demo github repository, which was a great starting point, as it had the touchscreen sensing framework set up, along with displaying to a VGA. Combined with the oscilloscope (as explained above), the VGA screen was cruical for debugging the touchscreen and figuring out the ADC range, however is not a component of our final design.
| Function | Implementation and Functionality |
setupX(void) |
Set X+ and X- to input to make these high-impedance, Set Y+ and Y- to output GND and VDD respectively |
setupY(void) |
Set Y+ and Y- to input to make these high-impedance, Set X+ and X- to output GND and VDD respectively |
repeating_timer_callback(struct repeating_timer *t) |
Calls setupX(), averages 16 reads from ADC that X input is connected to, Calls setupY(), averages 16 reads from ADC that Y input is connected to. Original demo code also scales the raw ADC readings to display them on a VGA. We troubleshooted our X and Y scaling using the VGA |
adc_x_min/max and adc_y_min/max |
1600 - 2200 and 450 - 3400 |
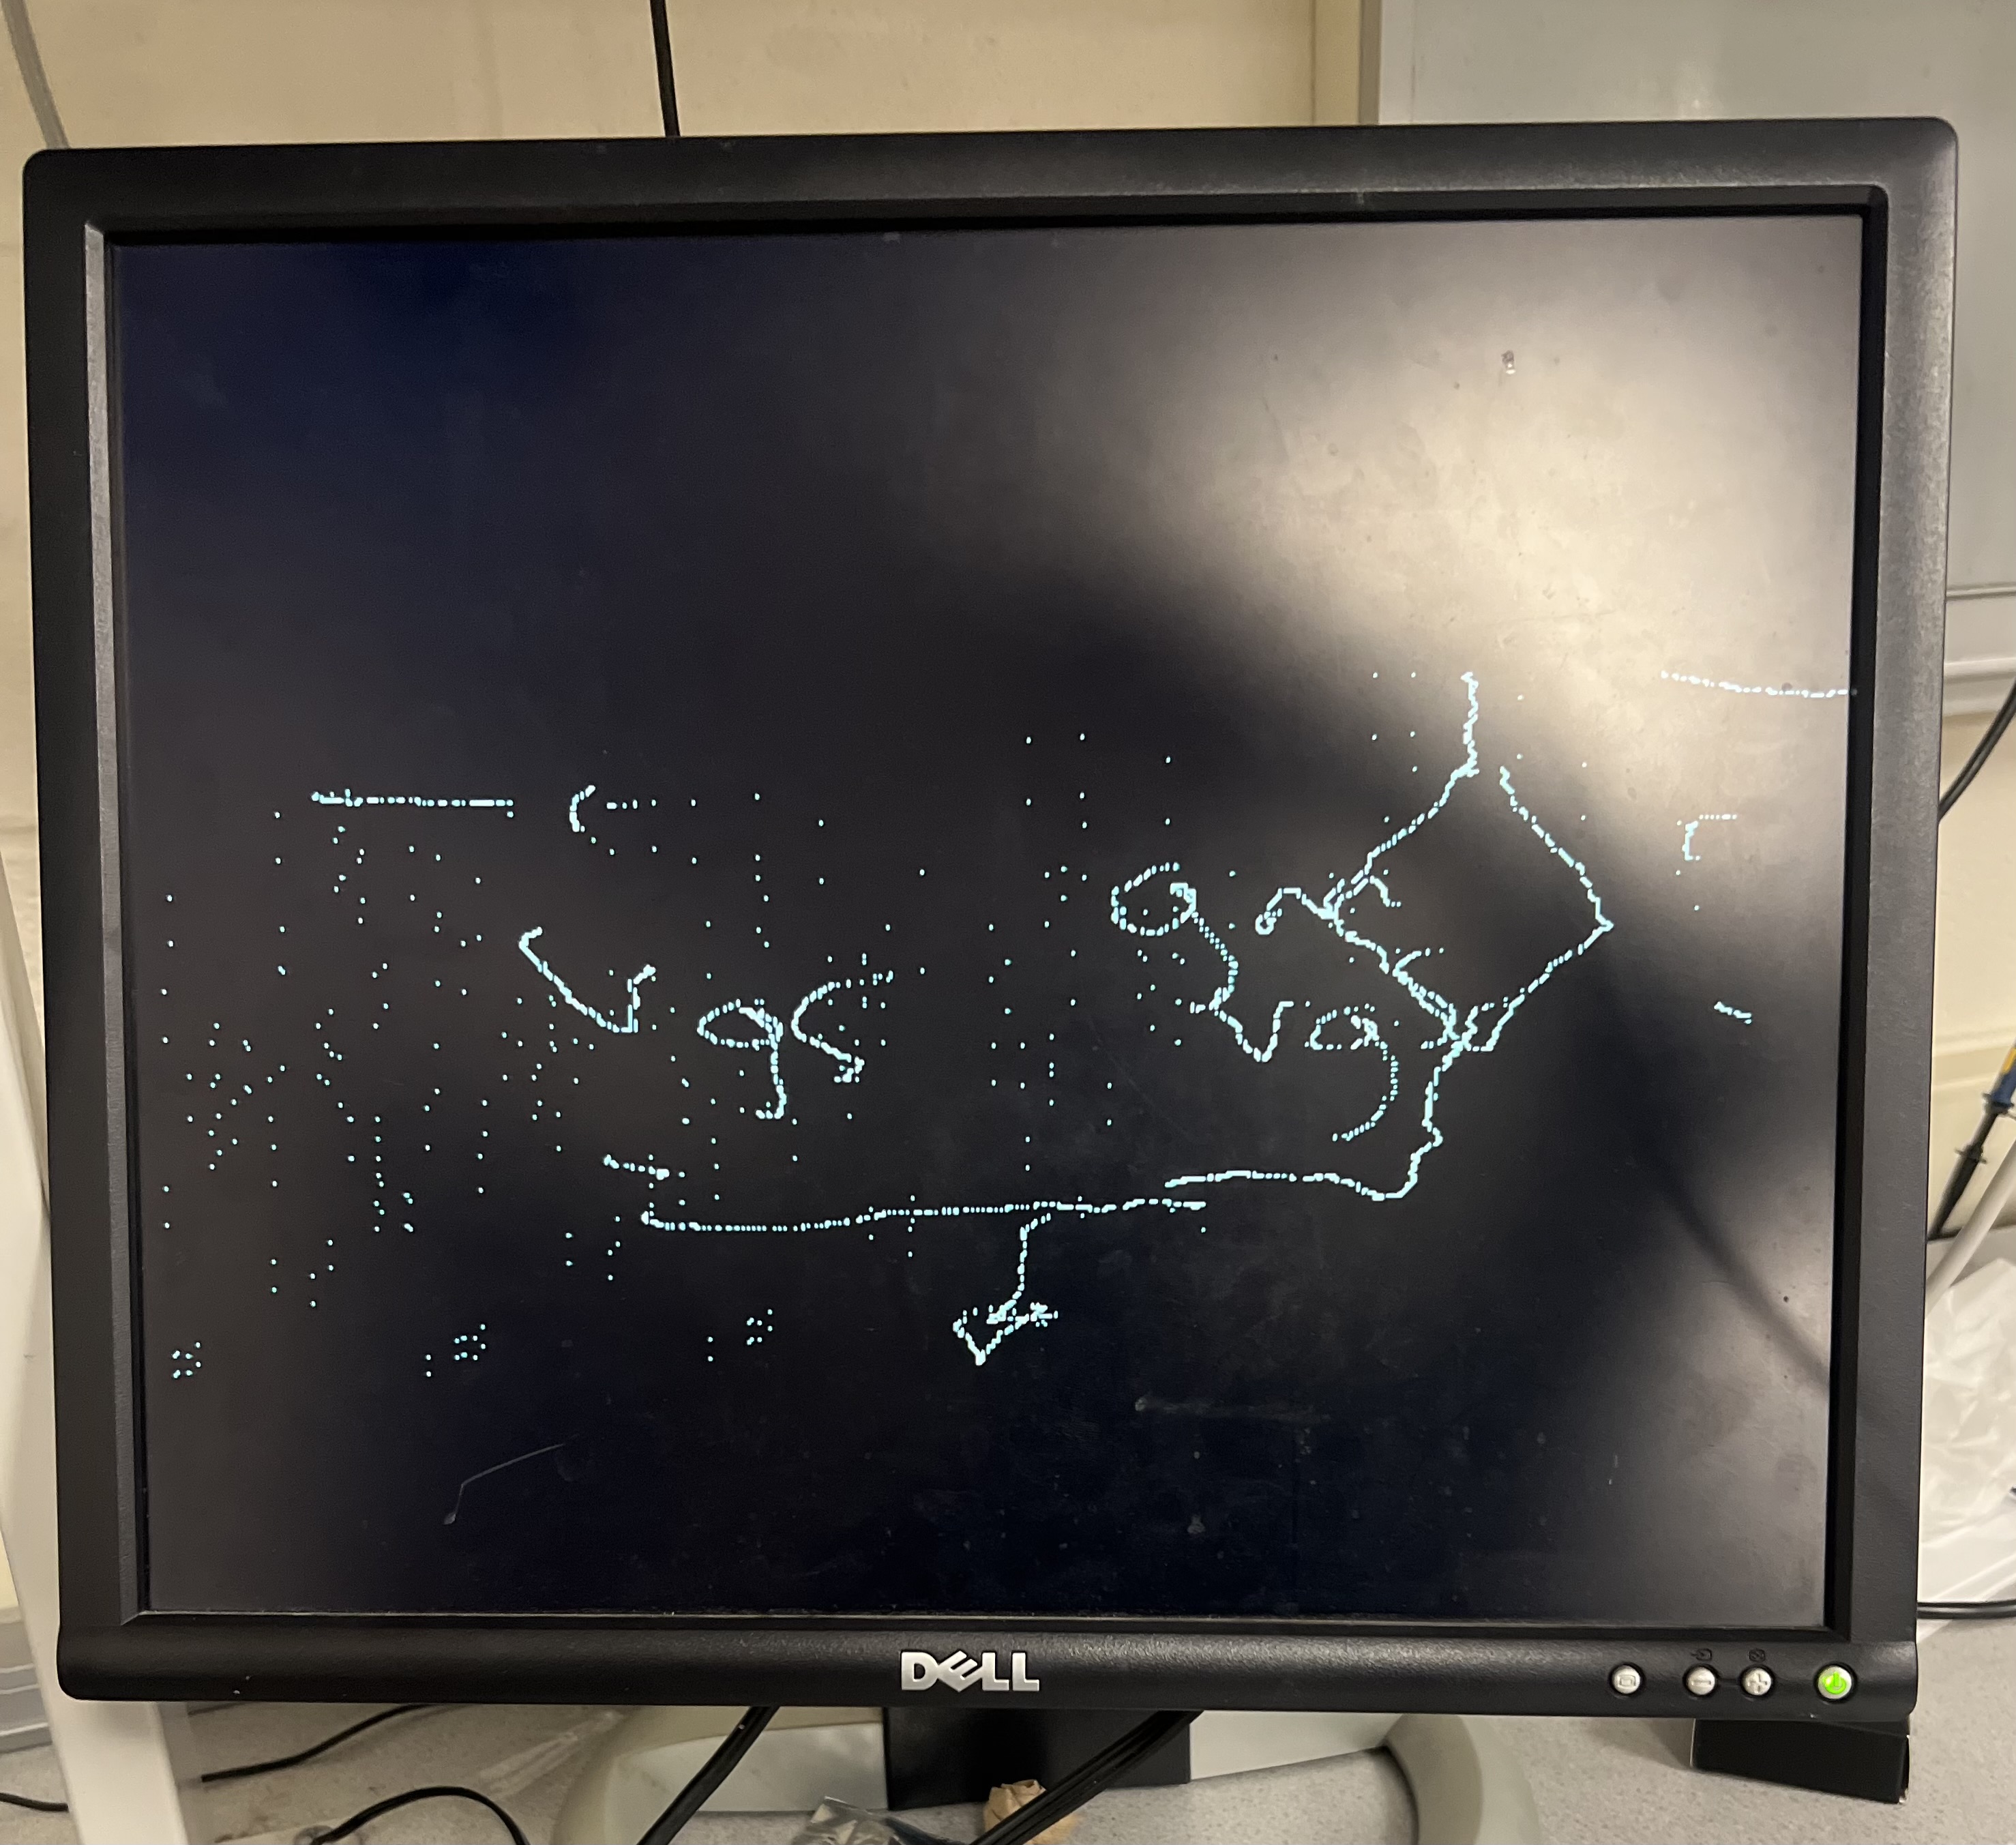
Image Processing
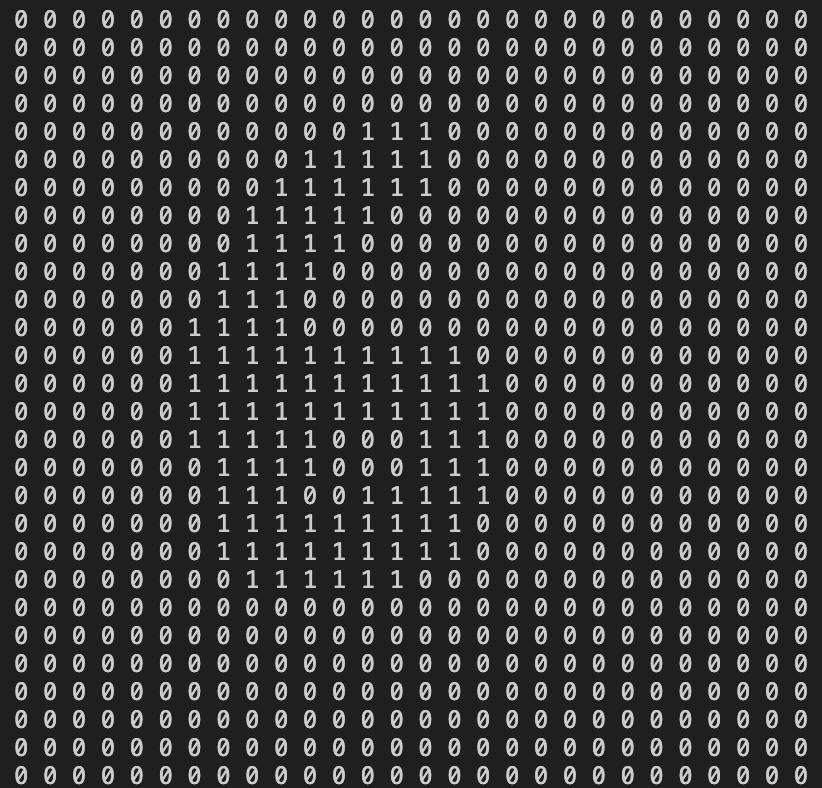
The next task to complete was being able to create the MNIST CNN 28x28 pixel image. The mapping process converts the raw ADC values to a bin index ranging from 0 to 27. The scaling is performed using linear interpolation.
The averaged X ADC value is mapped to the 28-pixel width using the formula:$$ i_{x} = 28 - \left( \frac{(x_{avg} - adc_{x min}) \times 28}{adc_{x max} - adc_{x min}} \right) $$
and similarly for Y.
We kept the image in greyscale (only one channel), to match the expected CNN input.
To improve the input image quality, we experiemented with a few different methods, either varying the width of the image or adding grey scale. Because of the slow timer ISR, and noise from the touchscreen, our first attempt at preprocessing was to draw a 3x3 square around every bin that was detected.
We also attempted with greyscale. The pixels that were directly touched were set to 255 (black), and the edges of the derived square were set to 127 (midpoint grey).
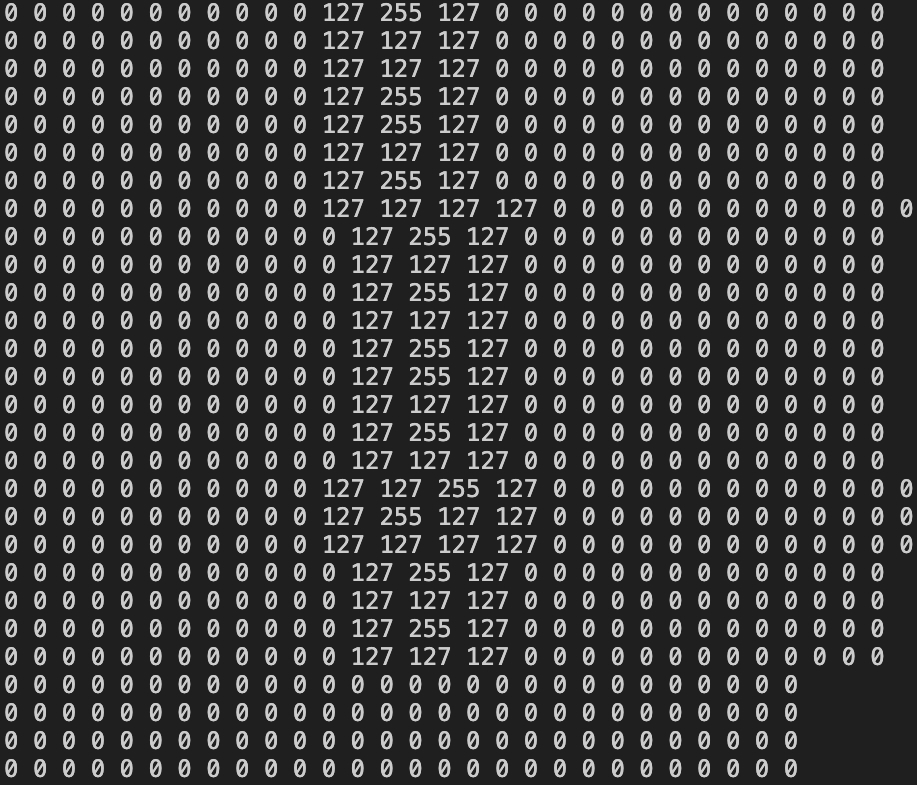
Even with the 3x3 drawn square, we would sometimes get pixel gaps in the image using Bresenham's line algorithm. This improved the image quality, however if a user drew one digit in multiple strokes, a line would appear between when the user picked up the stylus to where they put it down. This felt unintuitive from a user experience perspective, as they should not be constrained to drawing in one stroke.
In our performance analysis of the CNN model, we noticed that pure binary (either 0, white or 255, black) pixels had significantly superior classification accuracy. This was the image preprocessing we finally decided upon.

| Function | Implementation and Functionality |
read_touchpad(void) |
Accepts inputs within designated rectangle, converts X and Y input values (positions) into a position from 0-27, adds 3x3 square around touch point of black pixels into the array. Also rotates the array by 90 degrees to account for the orientation with which we attached the screen onto our PCB |
clear_touchpad(void) |
Zeros out all entries in the 28x28 image |
Classification
After training the model with tensorflow in Python, we have a .tflite binary FlatBuffer file. It stores all model information in a
contiguous byte array: an
operator-code table that lists every primitive the graph needs
(CONV_2D, MAX_POOL_2D, …), a single sub-graph describing the tensors, their shapes,
and the order in which operators will execute, and a pool
of immutable buffer blobs that hold the quantized weights and
biases.
Using xxd, we hex dump the .tflite file to a C .h header file, which stores all
of the model information into an unsigned char array. Since these are constants, they live in the Pico's 2 MB QSPI flash.
Because the FlatBuffer uses relative offsets instead of pointers,
the Micro Interpreter can read the structure in place—no heap
allocation, no memcpy, zero RAM overhead. When a kernel
needs its weights, it simply evaluates
baseAddress + offset and the cache streams the bytes over
QSPI just as if they were ordinary instructions, so the weights never actually
consume on-chip SRAM.
The MicroInterpreter is the small runtime that turns the static .tflite file into something the RP2040 can execute. When it is created we give it three pieces: (1) the model data, which stays in external QSPI flash; (2)
a table that maps the model’s op-codes to the compiled C kernels we linked in; and (3) a fixed block of SRAM called the tensor-arena.
MicroMutableOpResolver is a compile-time list that tells TensorFlow Lite Micro exactly which kernels our program needs. We create the resolver with a fixed capacity N (six in our case) and then call AddQuantize(), AddConv2D(), AddMaxPool2D(), AddReshape(), AddFullyConnected(), AddSoftmax(), for each of the different layer operations.
Each Add…() copies a small record of two function pointers (init and invoke) into the list. At link time, only those six kernels are pulled into the flash image, so unneeded operators (e.g. LSTM, SVDF, more complex tensorflow operators) are completely left out, saving tens of kilobytes of code. Because the table itself is just a few dozen bytes and lives in flash, it adds almost no RAM overhead.
When the interpreter reads the model, it looks up each operator code in this resolver, grabs the matching registration, and stores the pointers in the node structure so that init() and invoke() can be called later.
AllocateTensors() is the one-time set-up pass that turns the static model into runnable data structures. As the interpreter walks the FlatBuffer once, it looks up each operator
code in the MicroMutableOpResolver. The matching entry gives it the kernel’s init function, which is called immediately to create a small, permanent user-data struct (padding, quant-multipliers, etc.) inside the tensor-arena. Next, the kernel’s prepare routine tells the allocator how much scratch RAM it will need during inference.
A greedy lifetime planner then lays out all activation and scratch buffers so layers that are never live at the same time share the same slice of SRAM, keeping the tensor-arena compact. Finally, the interpreter writes pointers for every tensor header, including input(0) and output(0). Because every byte comes either from this pre-planned arena or straight from flash,
the entire graph can later be executed with no heap calls and no extra copies.
interpreter->Invoke() is the actual run-time loop that actually performs an inference. The interpreter steps through the list of nodes it created during AllocateTensors(). For each node it already knows the invoke function because that pointer was supplied by the MicroMutableOpResolver. When invoke is called the kernel:
- reads
its user-data struct allocated earlier by
init()to pick up pre-computed constants such as padding or per-channel scale factors, - grabs its input tensors and any scratch buffer directly from the tensor-arena,
- streams its constant weights and biases straight from flash via the cache,
- performs the math and writes the outputs back into another slice of the arena.
The interpreter then advances to the next node and repeats the process until the last layer (Softmax) finishes. No dynamic memory is allocated, no data are copied except for the arithmetic itself, and every kernel runs with a tight, predictable stack. This keeps latency low (<1 ms for our digit CNN) and guarantees the entire inference fits within the RP2040’s compute and memory resources.
| Function | Implementation and Functionality |
cnn_setup(void) |
Calls tflite::InitializeTarget() to enable RP2040 timers / printf.
Maps the .tflite FlatBuffer sitting in flash with GetModel() and checks the schema version.Builds a six-entry MicroMutableOpResolver (AddConv2D(), AddMaxPool2D(), …) so only those kernels are linked.
Instantiates a static MicroInterpreter with the model, resolver, and a 30 KB tensor-arena in SRAM, then runs AllocateTensors(): this sets up tensor headers, runs each kernel’s init(), and plans scratch/activation buffers inside the arena.
Caches pointers to input(0) and output(0) tensors for fast access during each frame.
|
cnn_run_if_frame_ready(void) |
Executes only when the global flag frame_ready is set by the main loop FSM.Quantizes the 28 × 28 grayscale image: each pixel value px is scaled by 1 / (255·scale), offset by zero_point, and cast to int8; fixed-point math (fix15) avoids floating-point on the Cortex-M0+.Calls interpreter->Invoke(); the MicroInterpreter walks the eight graph nodes, pulling weights straight from flash and using the arena for all activations.Converts the 10 × int8 logits in output->data back to probability with (q – zp) × scale; logs each p[i].Finds the best, counts how many logits are non-zero, and asserts error_threshold_reached when nonzero_classifiers >= 5 — a simple confidence check to reject ambiguous strokes.
|
OLED Display
The project’s user interface is a small 128 × 64-pixel monochrome OLED panel driven by the SSD1306 controller. The display connects to the RP2040 over the standard I²C bus, requiring only two signal wires plus power and ground, which makes it ideal for a compact, portable designs. Because the SSD1306 has its own 1 KB display RAM, the Pico merely sends the updated framebuffer when the image changes and the controller then refreshes the pixels autonomously. In our application the OLED serves as a real-time heads-up display: it shows the sequence of digits recognised by the CNN, flashes “DONE” when seven characters are entered.
To keep the on-screen readout tidy we maintain a tiny ring buffer, history[HISTORY_LEN], that stores up to seven recently classified digits. Each time the CNN returns a new prediction it is pushed into this buffer; the code then rebuilds a null-terminated C-string and calls oled_show_string_center(). That helper measures the string’s pixel width (len × 7 px for the built-in 7 × 10 font), subtracts it from the 128-pixel screen width,
and starts writing at x = (128 – text_w) ⁄ 2, so the entire digit sequence always remains perfectly centred no matter how many characters have been entered. A hardware “BACK” button simply decrements history_count, rebuilds the string without the last character, and re-renders it. Because the buffer already holds every previous digit, no reclassification or extra state tracking is required, making back-spacing instant and flicker-free.
| Function | Implementation and Functionality |
oled_init(void) |
Configures the RP2040’s default I²C bus at 400 kHz, assigns SDA/SCL pins, enables pull-ups, then calls SSD1306_Init(). Clears the SSD1306’s on-chip 1 KB display RAM and pushes a blank screen, establishing a known starting state. |
oled_show_string_center(const char *str) |
Measures the string’s pixel width (len × 7), computes an X-offset so the text is horizontally centred and a Y-offset so it sits mid-screen, writes the glyphs into the framebuffer, then updates the display. |
oled_show_done(const char *digits) |
First calls oled_show_string_center() to keep the entered digits visible, then prints the label “DONE” just below by calculating a second set of X,Y offsets. Gives the user visual confirmation that seven digits have been captured. |
oled_clear(void) |
Clears the framebuffer and pushes the blank screen. Used when the CLEAR button is pressed to wipe both the digit history and the OLED. |
oled_begin_project(void) |
Shows a two-line image (“ECE 4760 Final” and netIDs) on power-up. It centres each line with the same width-calculation routine used elsewhere, . |
System Level Software Organization
Main control loop. Execution starts in main() after the RP2040 peripherals (I²C, ADC, GPIO) are initialised. The application then sets up the CNN model (cnn_setup(void)), then enters a single while(1) loop that is steered by a two-state finite-state machine (FSM): DRAWING and CLASSIFY.
DRAWING state: A 250Hz repeating timer ISR alternates between X and Y drive configurations, samples the resistive touchscreen using the ADC, low-pass filters each axis with a 16-sample average. The foreground loop calls
read_touchpad()to map these raw values into 0-27 image indices, write 3 × 3 pixels into the globalimg[28][28]buffer (already rotated for board orientation). If the CLEAR button is pressed,clear_touchpad()zeros the image and clears the digit ring buffer.CLASSIFY state. Triggered the ENTER button. The loop sets
frame_ready = true, lights the status LED, and callscnn_run_if_frame_ready(), which quantises the image, invokes the TFLite-Micro interpreter, and returns the top-1 digit and a confidence flag. If an error is detected (incnn_run_if_frame_ready(void)), the red LED on the PBC is momentarily lit, the touchscreen image is cleared and returns to DRAWING for the next input. If there no error is detected, the digit is pushed into thehistory[]ring buffer and redrawn on the OLED. If seven digits are present the OLED shows “DONE,” pauses 3 s, clears the history, and the FSM reverts to DRAWING; otherwise it simply clears the touchscreen image and returns to DRAWING for the next input.
Input events and debouncing. Three push-buttons, ENTER, CLEAR, and BACK, generate GPIO falling-edge interrupts. A single ISR (button_irq_handler()) services them by comparing time_us_32() to a per-button last_*_press timestamp; a (BUTTON_COOLDOWN) filters out contact bounce, debouncing, without additional hardware. The handler toggles app_state, clears the digit history, or decrements history_count to implement “backspace,” then returns immediately.
Concurrency model. The design follows a simple foreground task + ISRs pattern: time-critical sampling and button detection run in interrupts, while higher-latency work, CNN inference, OLED updates, run in the main loop.
Software Challenges
The majority of software challenges revolved around the CNN model. Initially, training a multi-layer CNN in TensorFlow required multiple iterations to balance model complexity against memory constraints. The objective was to maintain a sufficient number of convolutional and dense layers to capture meaningful spatial features while keeping the model size small enough. Quantizing the model to 8-bit integer weights and activations was essential, but this process introduced accuracy loss that necessitated further fine-tuning. Additionally, multiple versions of the model were trained and evaluated to identify a structure that provided acceptable classification accuracy without exceeding memory constraints.
The second major challenge was porting the trained model to the RP2040 and configuring the TFLite Micro interpreter to handle inference. Implementing the CNN required configuring the interpreter to allocate tensor buffers in a single contiguous memory block. Ensuring that the tensor arena was appropriately sized to accommodate all tensors without overflow was critical, as improper sizing led to runtime crashes and unexpected behavior. Additionally, quantized inputs had to be carefully scaled and converted from fixed-point values to 8-bit integers, adding another layer of complexity to the inference pipeline.
Results of the Design
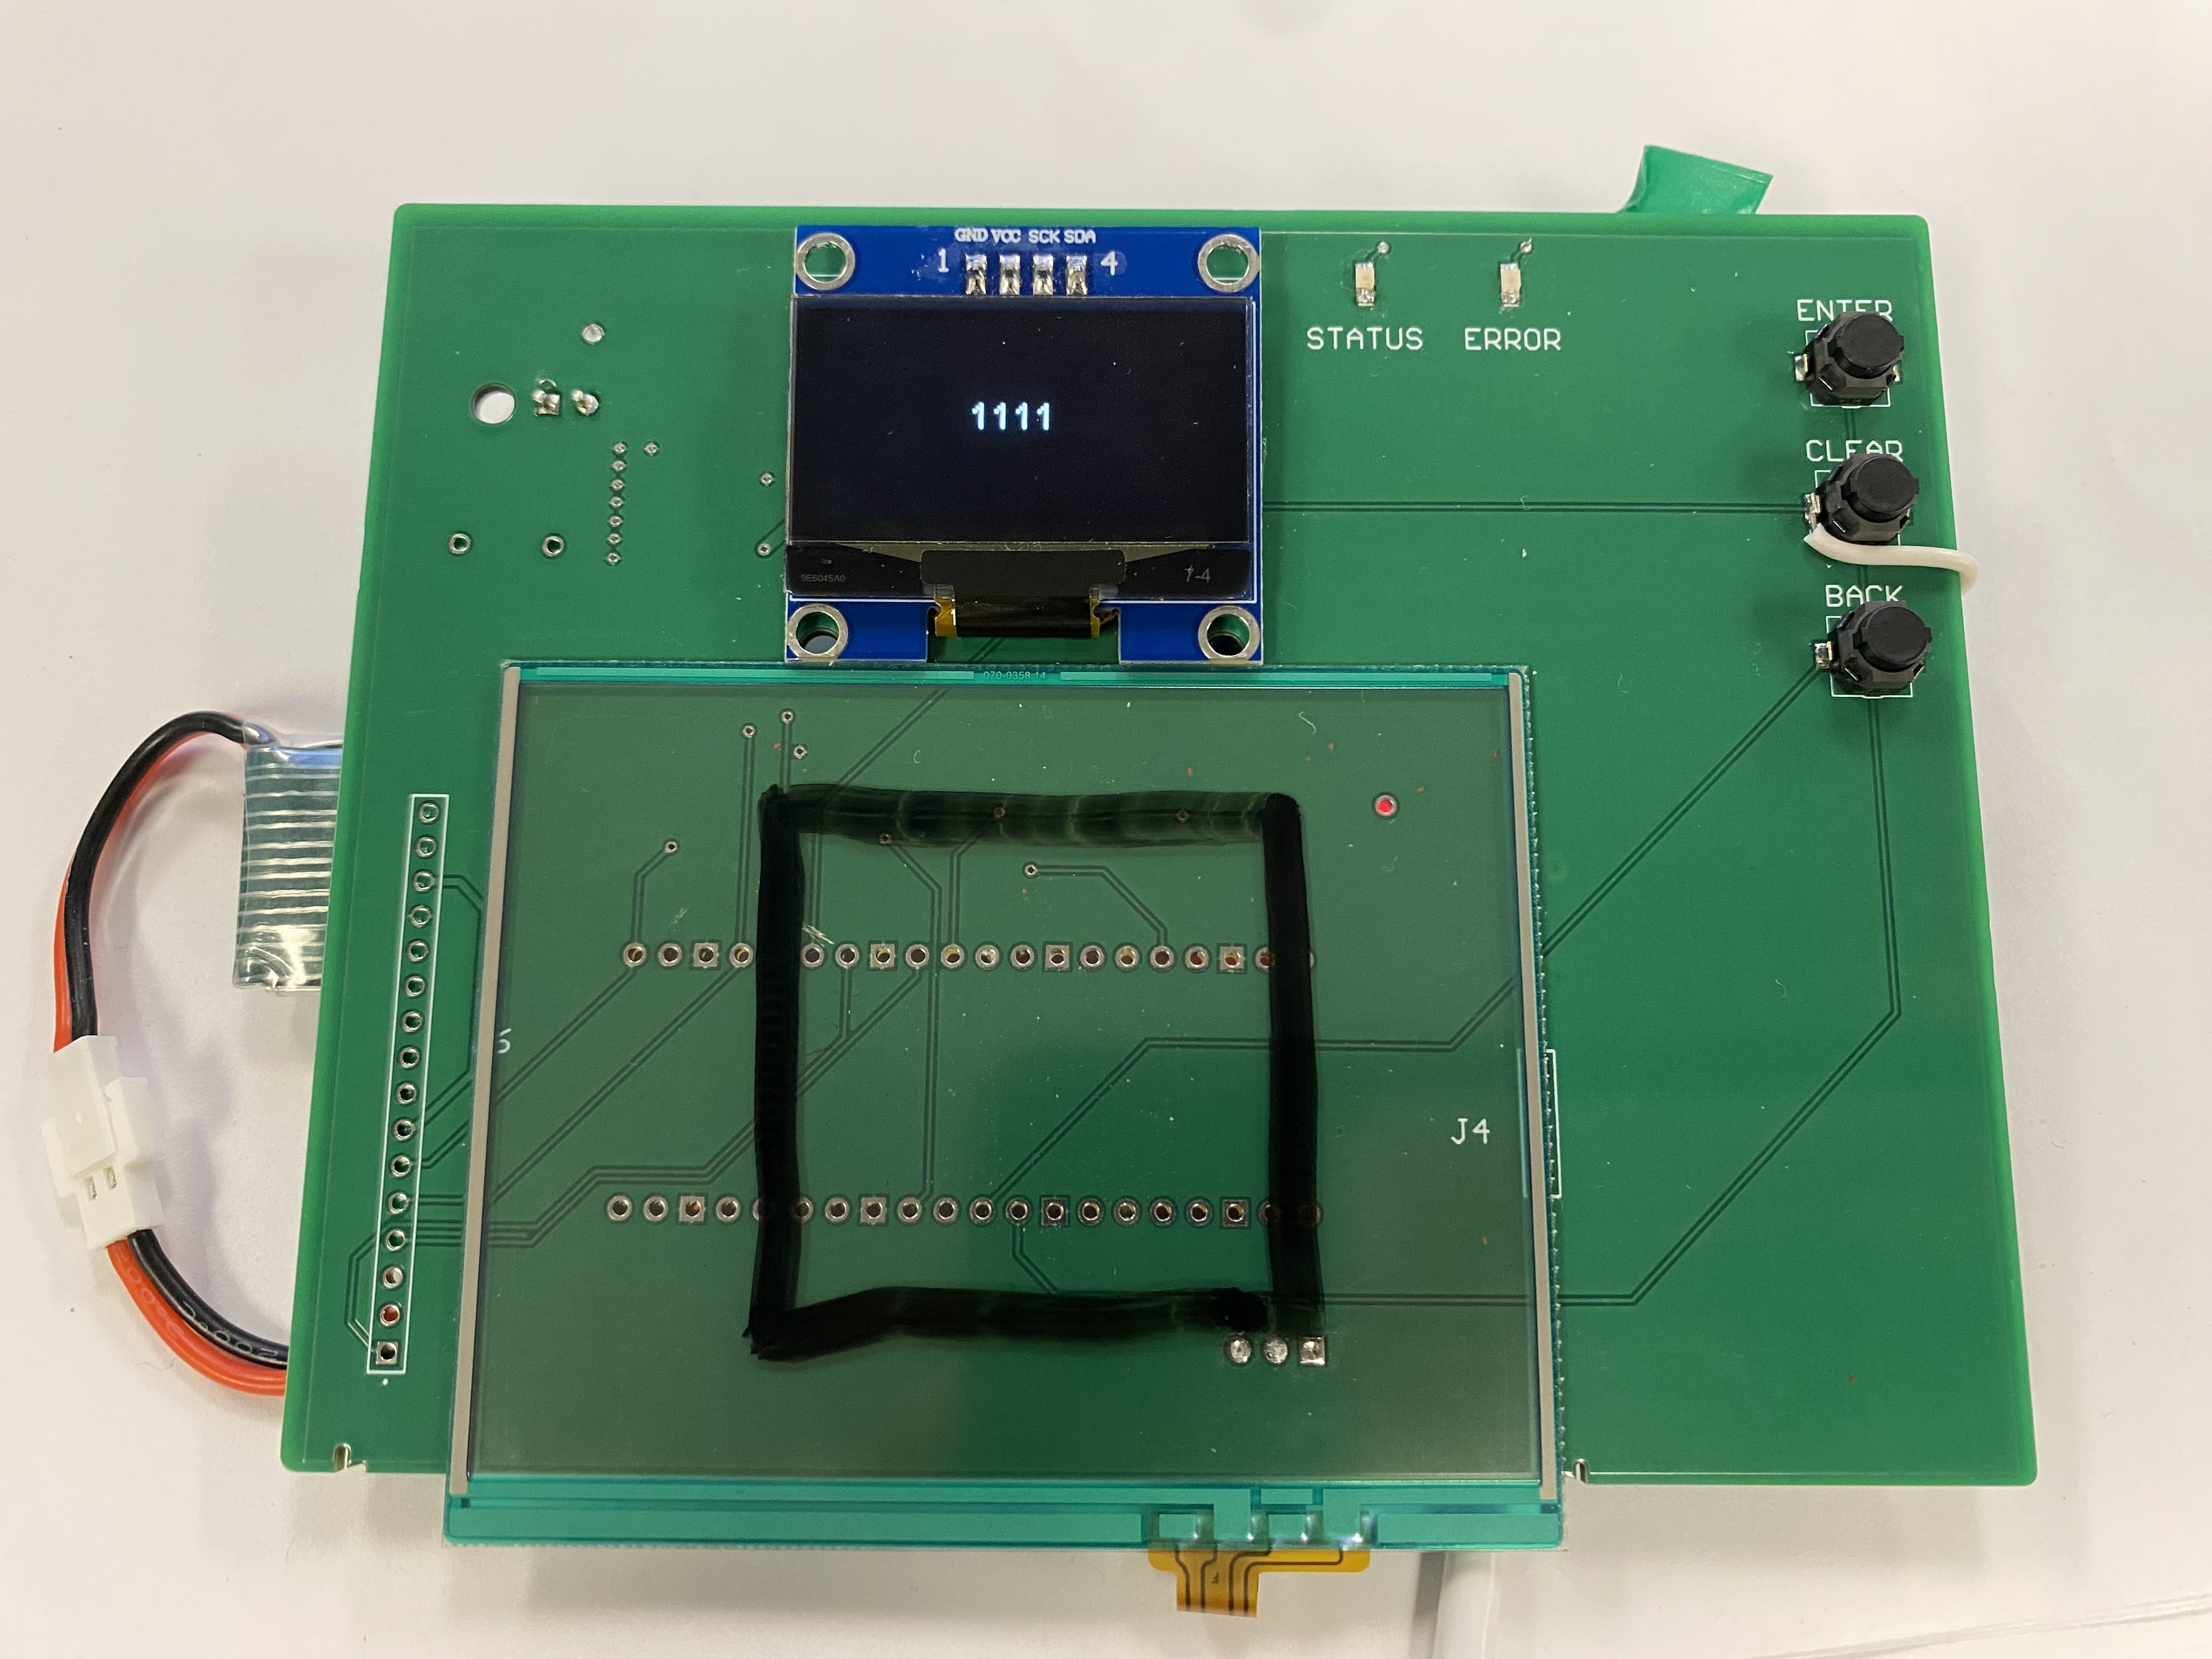
We were able to successfully get the system to classify numbers 0-9, and display 7 digits (Cornell student ID) on the screen.
Testing
To test our model and touchscreen concurrently, we used an interative testing methodology
- Model: Create CNN model, train, and test in Python with sample images we created with MSPaint. These tests would achieve very high classification accuracy.
- Touchscreen Image: To then see the performance of the image preprocessing, we loaded the model onto the RP2040, and ran the entire data processing pipeline. With our first model, we were only classifying a few digits, inconsistently. We then experimented with different preprocessing techniques explained above.
- Repeat Steps 1 and 2: If the classification accuracy was not to our standard after various preprocessing attempts, we would create and train a new model, and then test with our set of MSPaint samples. After balancing model complexity and size, we would put load it back onto the RP2040, and repeat our preprocessing methodologies.
It is important to note that we also tried creating a digit+letter CNN model, using the EMNIST (Extended MNIST) dataset. While trying to keep the model size small, we could not even achieve high accuracy using our MSPaint samples. After further iterations, accuracy improved, yet necessitated a much deeper model (~500 KB nonquantized, ~100 KB quantized). This model, along with its numerous operators, would not fit and compile onto the RP2040.


Accuracy
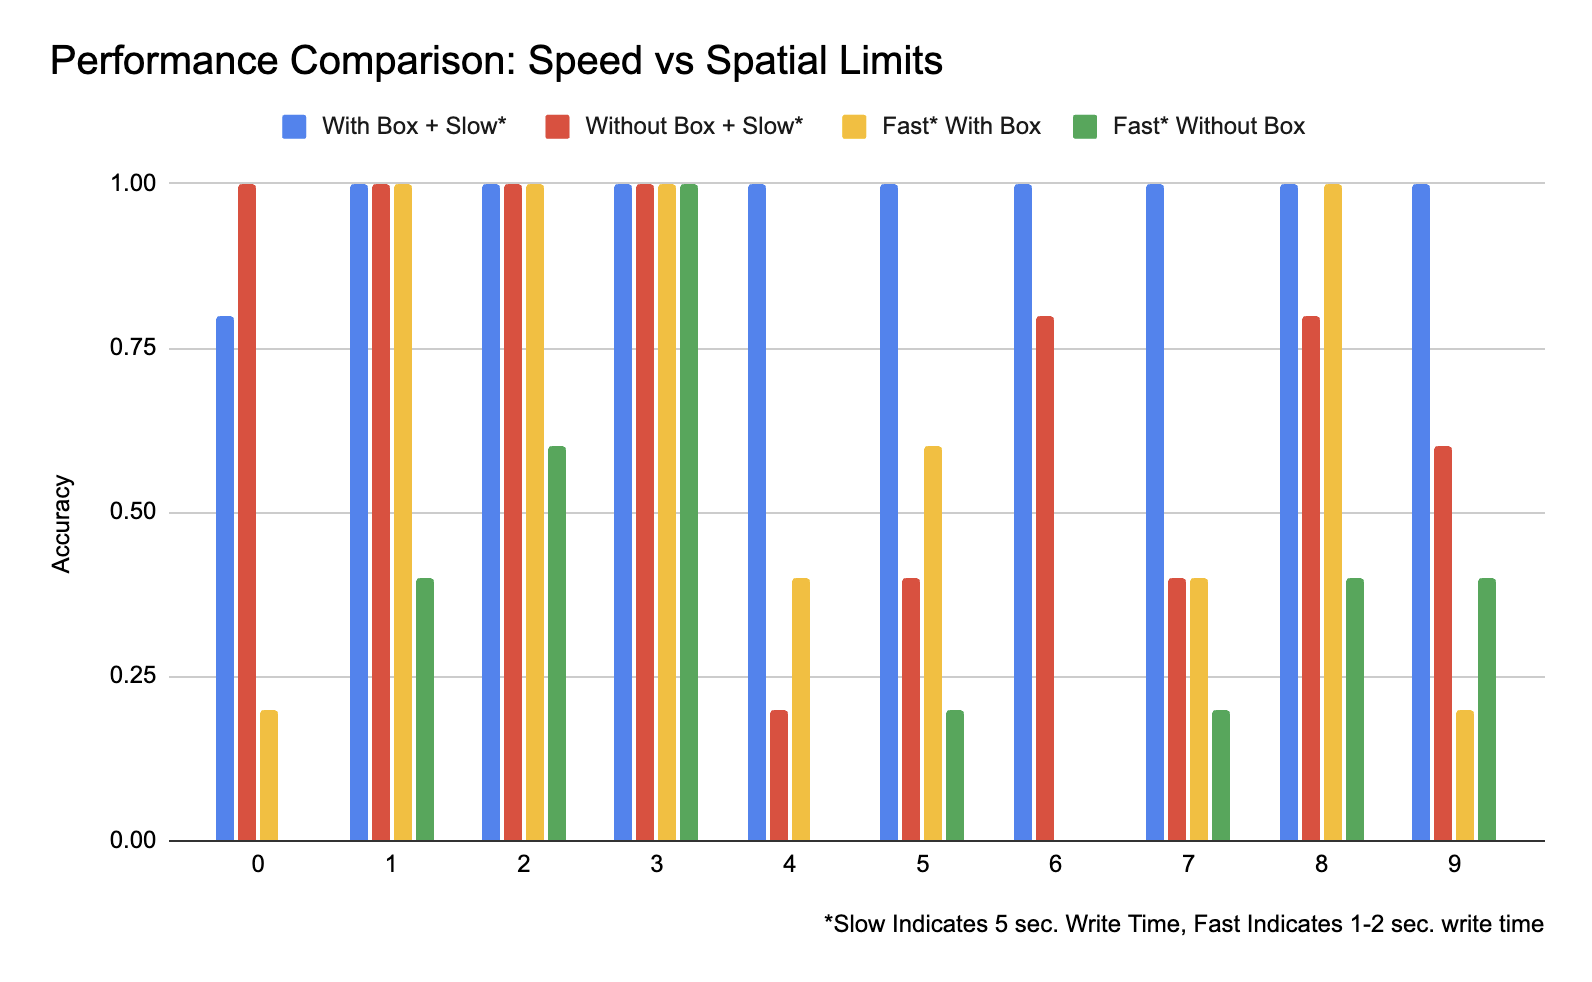
The accuracy of our model is highest when there are both spatial and temporal limits. We drew a box, ensuring more evenly spaced input, as well as testing the speed of writing with which the model could still make correct classifications. We conducted testing of the system with the 4 possible combinations of limitations. Slow indicates that each digit was written using 5 seconds, fast indicates that each digit was written in about 1-2 seconds.
A few interesting results were found, which was that a few numbers are fairly robust to speed variations. However, overall performance degrades as a person attempts to write faster, and the explanation for this behaviour is that when a person is writing fast, every x-y coordinate is not registered, producing a poor classification. This was confirmed upon viewing the 28x28 arrays. Overall, when digits are written using 5 seconds and evenly spaced the performance of the system is accurate.
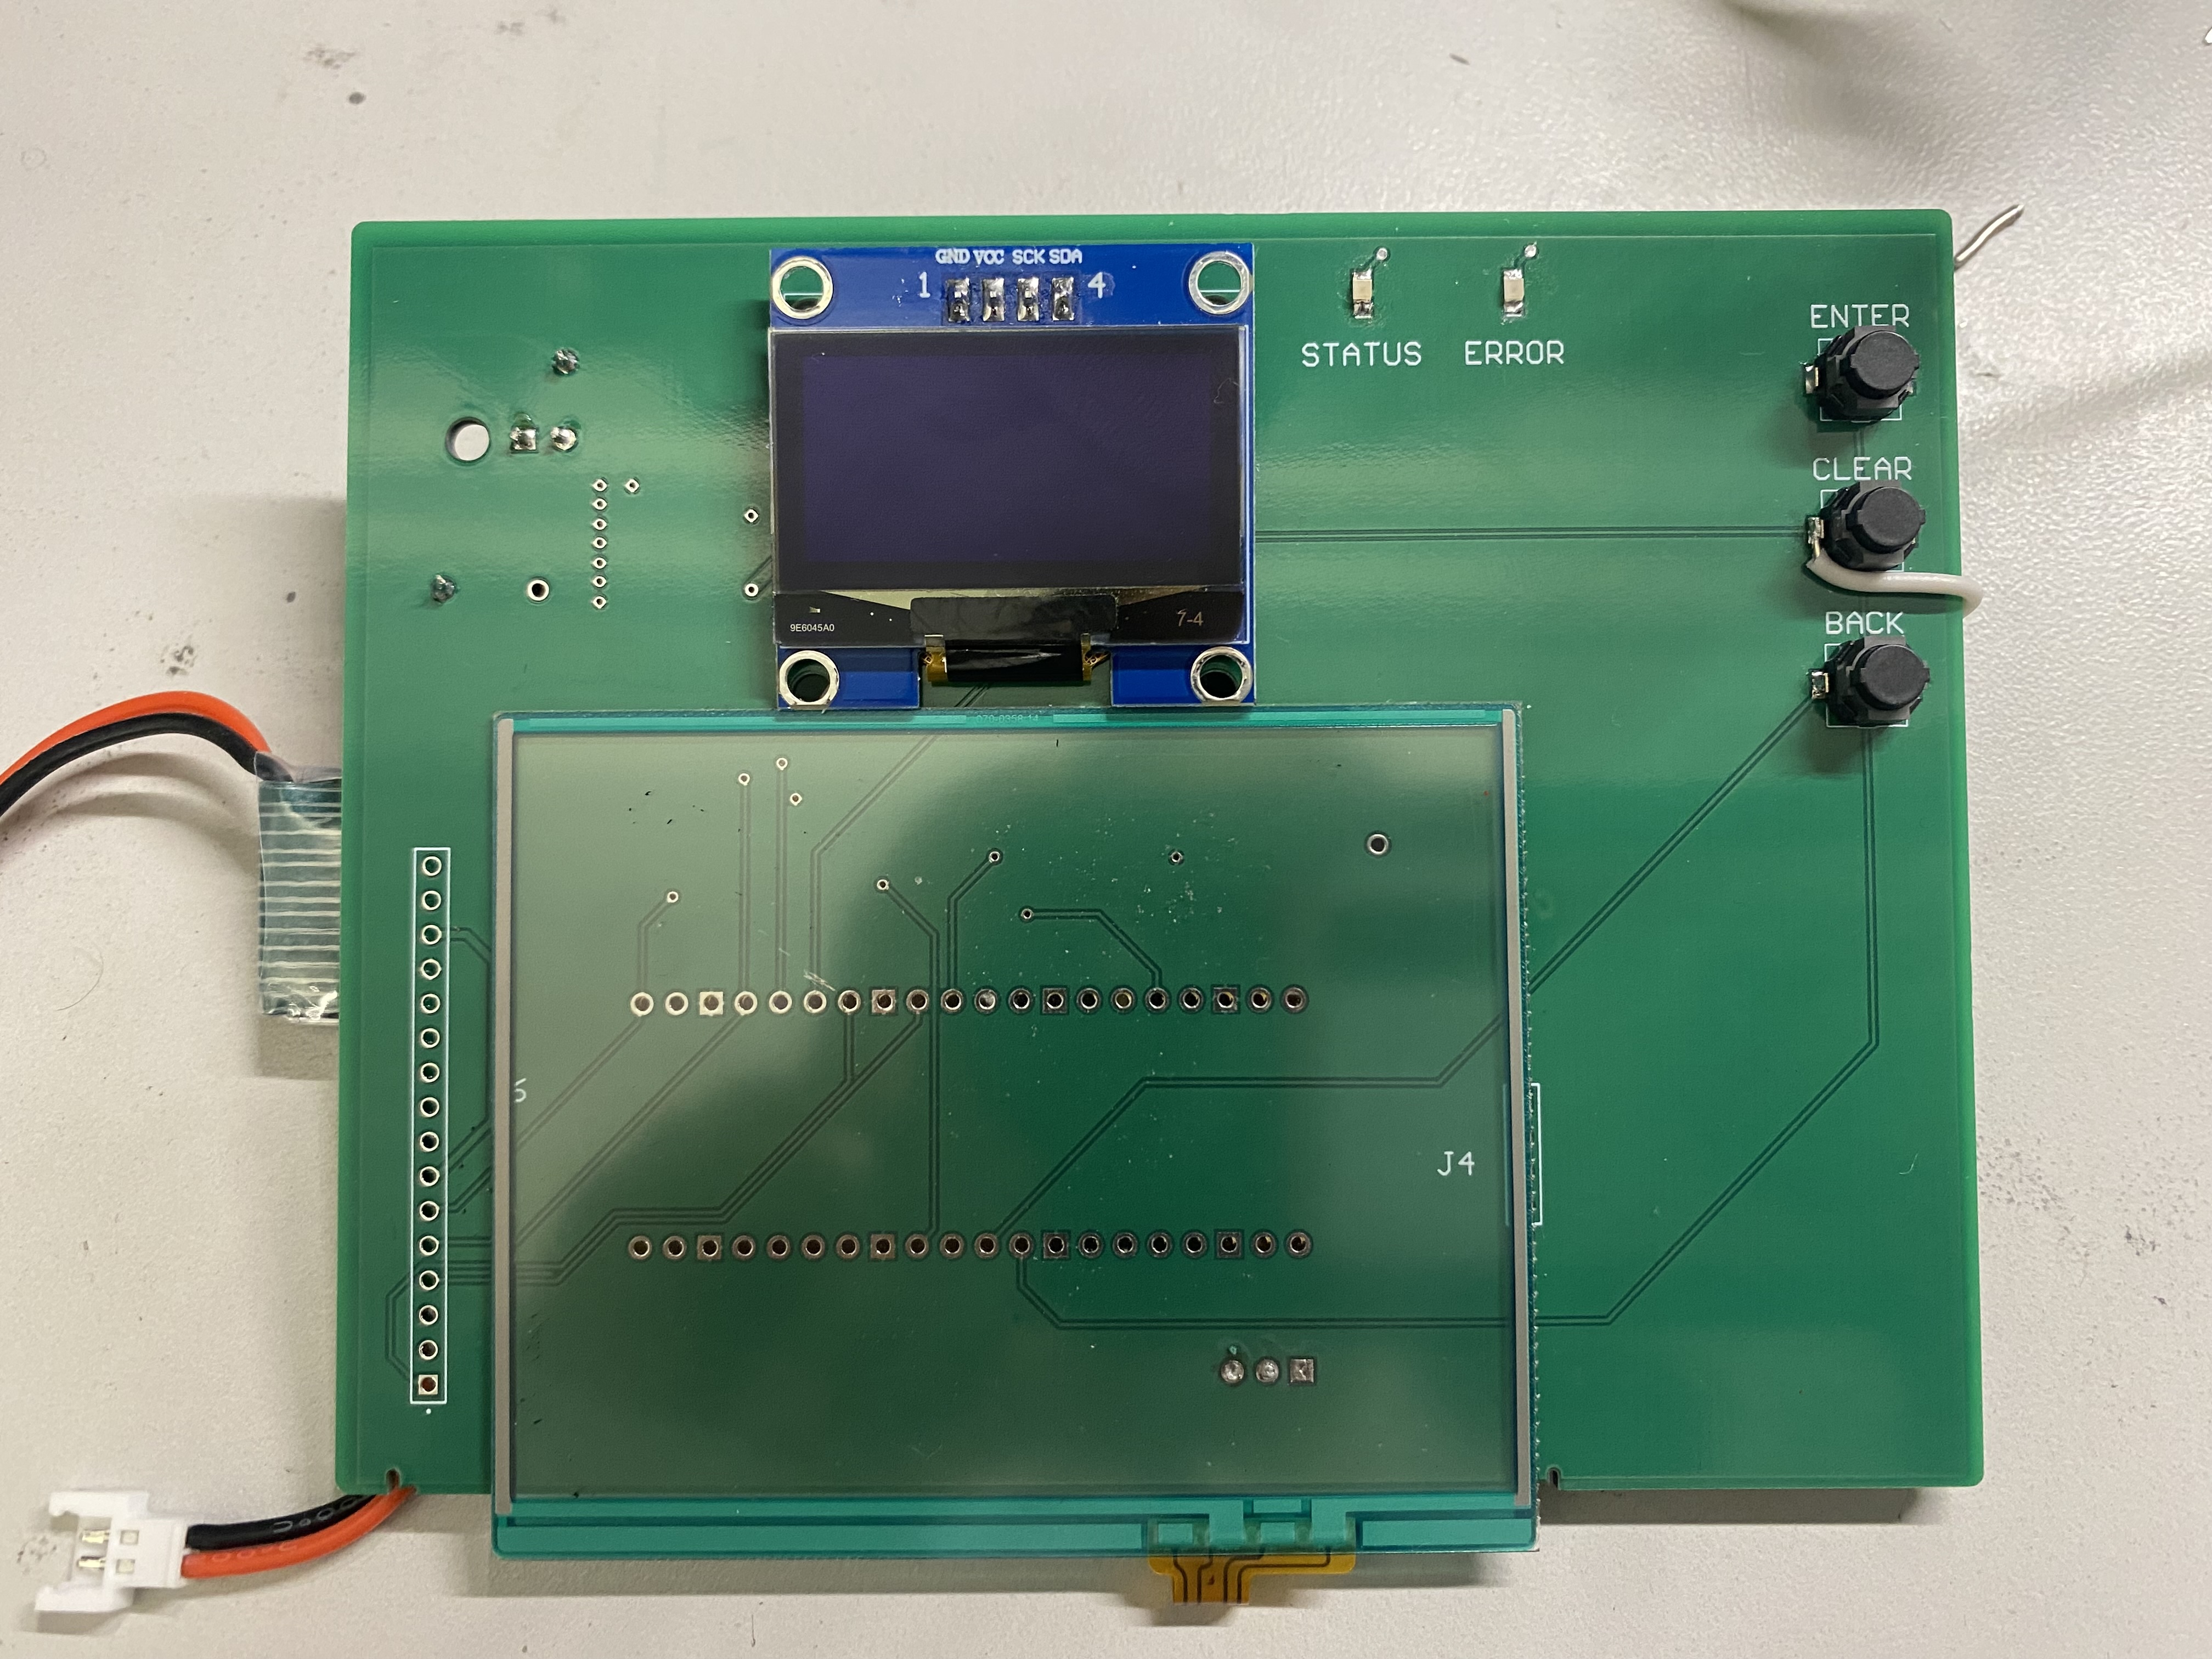
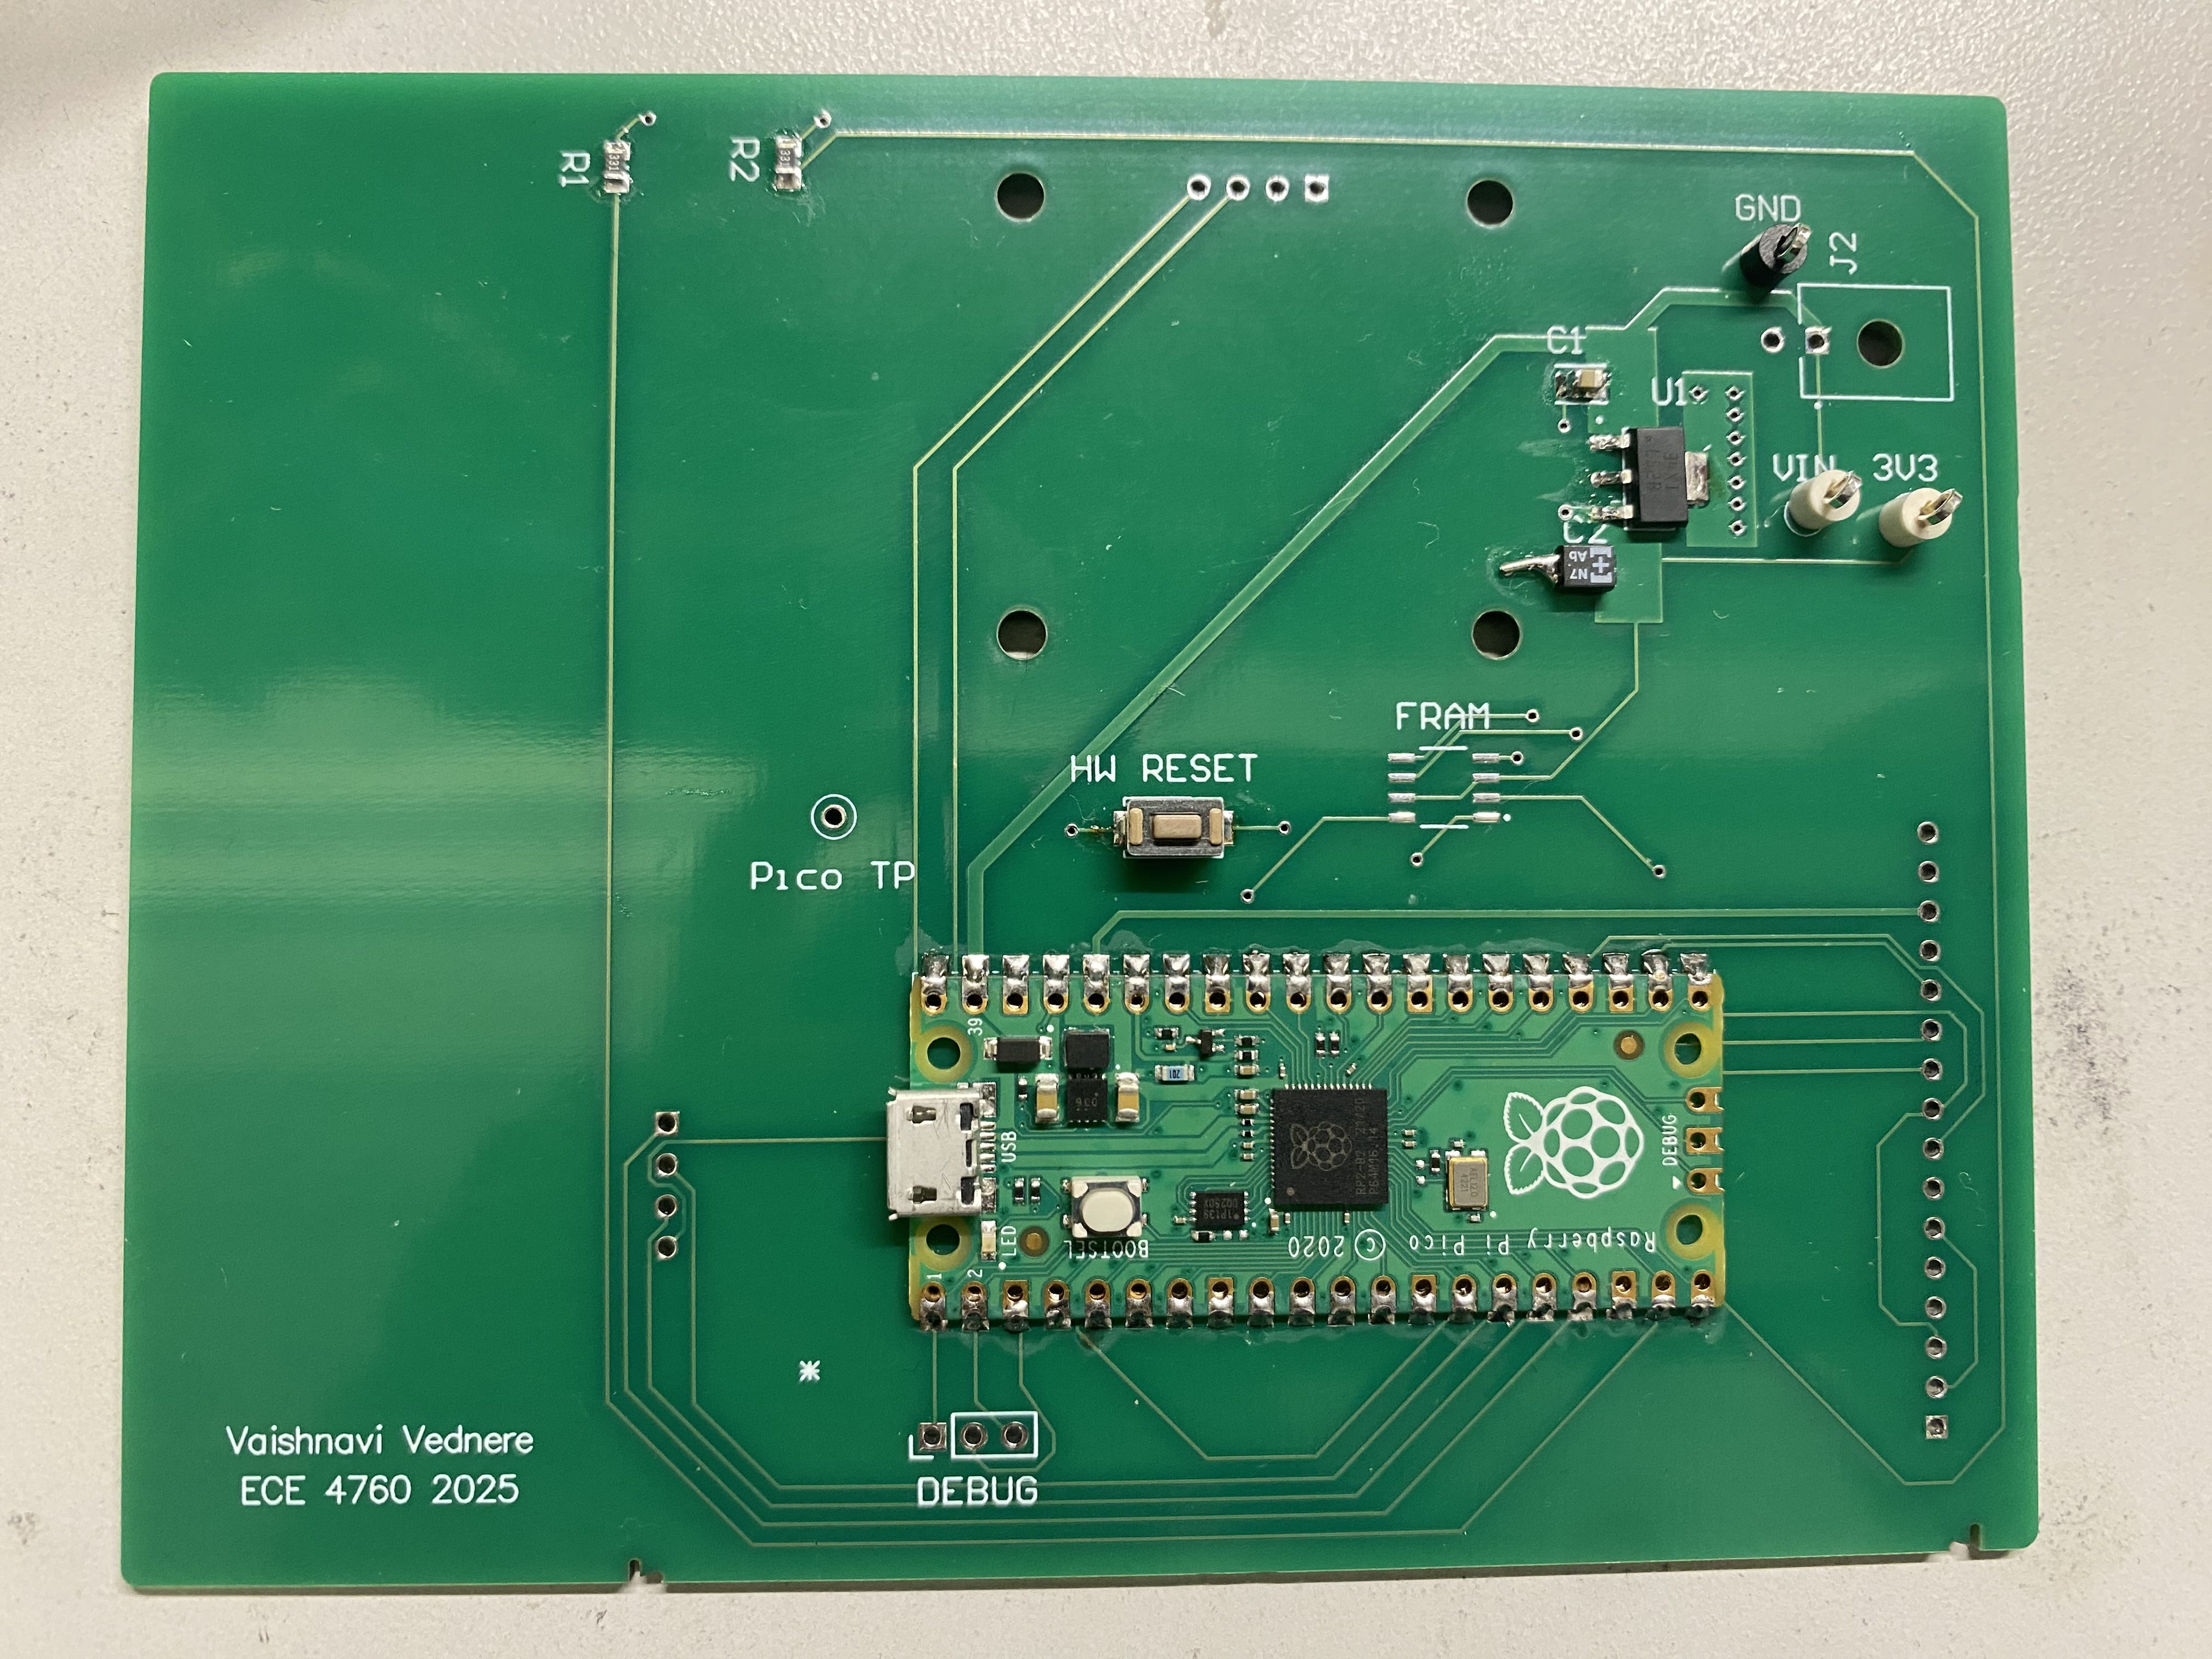
Safety
Safety considerations in the design mainly occurred during the PCB design phase, by ensuring all the delicate components and the Pico were placed on the backside of the board. Only the user interface is visible and accessible on the front of the board. The maximum voltage present in the system is ~4V from the battery to power the Pico and the OLED screen. The current draw of the system is not high, so safety from this aspect is not a significant concern. Additionally, a physical hardware reset button was added using the RUN pin on the Pico, such that the user never has to physically unplug and replug in the battery, as this poses the largest damage risk to the system. Accidentally attempting to plug in the battery with reverse polarity could damage the components on the board.
Usability
The system is usable by anyone who is able to write Arabic numerals. Upon trial and error, a number that fills a smaller rectangle on the resistive touchscreen slowly has the highest chance of classification. So, each number to be classified should be written and contained in the rectangle drawn on the resistive touchscreen, which is something to be noted during use. It does also require the user to draw neatly, making sure that only the pen in contact with the touchscreen and taking care to not touch any other part of the touchscreen. There is no limit on the time after a user has drawn a number to classify it, so this allows the user to take as much time as they would like to draw. Additionally, the backspace button allows the user to reattempt drawing numbers if they accidentally make a mistake.
Conclusions
Overall, we were surprised at the capabilities of the RP2040 to run various versions of TinyML models. We ran into issues with the touchscreen, such as noise and calibration. We were still able to reach a high classification rate, which seems to be error-prone mainly as a result of user input error. However, upon testing the model with numbers drawn on MS Paint, we found a 100% accuracy, despite the small size of the model. Next time, we would have started off with reading direct analog input, and then attempted to port over the SPI driver, such that we could use the original screen and display the user's input on the LCD as they write it.
Extensions
It would be an interesting experiment to try different kinds of neural networks as opposed to the classical CNN. We might have tried a visual transformer, for example. If we had more time, we would have tried to implement letter character classification. Additionally, adding more external memory and interfacing the SD card with the system could be useful in the application sense to store the classified input as an array of student IDs.
Intellectual Property Considerations
As stated above, this project extensively utilized open-source libraries and publicly accessible resources to implement the CNN model and touchscreen interface. TensorFlow Lite Micro, released under the Apache 2.0 license, was employed for the inference pipeline, allowing for free modification and redistribution. Similarly, the OLED display driver library (OLED_SSH1106_I2C) is a public domain resource, and the resistive touchscreen framework is based on Hunter Adams' demo code, which is openly accessible for educational purposes.
No proprietary IP was incorporated in this project, and no reverse engineering of existing products was conducted. Additionally, we did not sign any non-disclosure agreements to obtain components or libraries. The CNN model architecture itself is a standard implementation based on well-established neural network designs, with no proprietary or patented layers.
While there are no patent opportunities identified for this project, the concept of implementing quantized machine learning models on low-cost microcontrollers for real-time classification tasks is a growing area of interest, with potential for future research and commercialization.
Appendices
Appendix A: Acknowledgements
The group approves this report for inclusion on the course website. The group approves the video for inclusion on the course youtube channel.
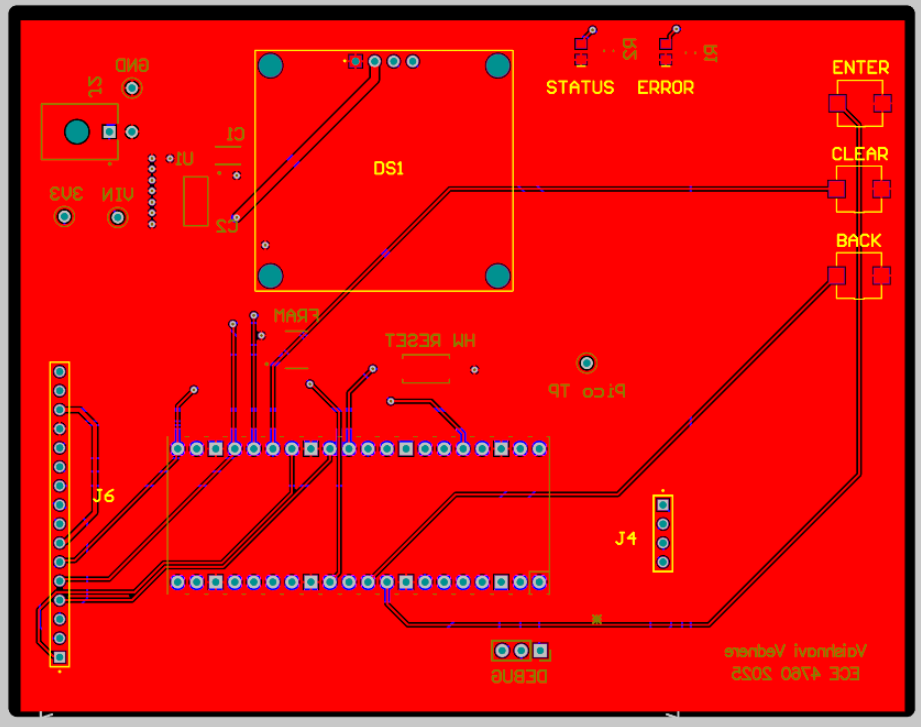
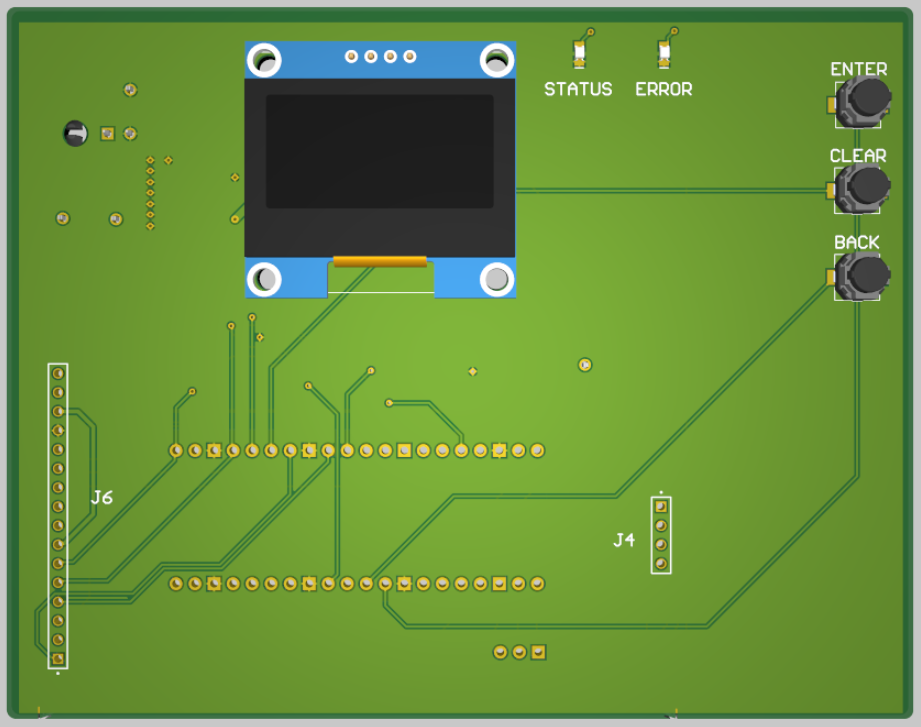
Appendix B: Schematics
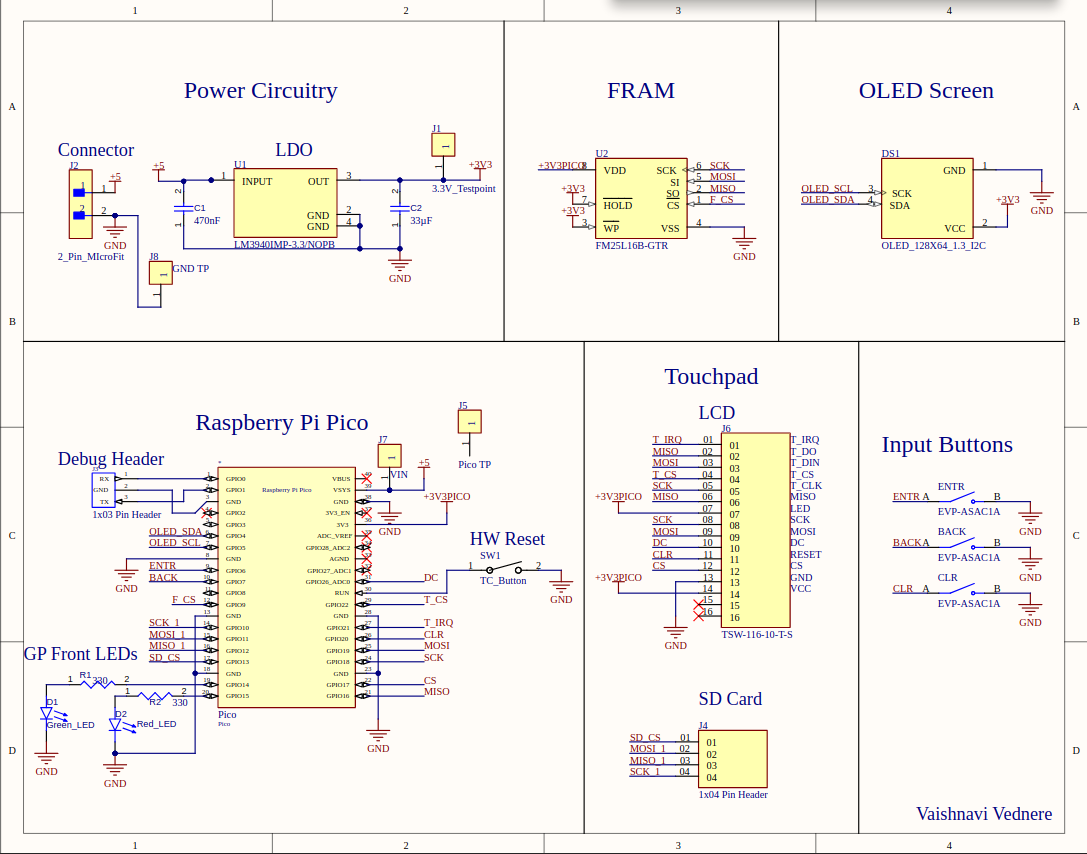
Below is the schematic, layout, and 3D view of the PCB. A PCB was created with the intent to create a portable project and is not stricly necessary to complete this project.
Appendix C: Work Division
The work division was split equally amongst both partners, both working on the hardware and software components
Vayun setup and configured the resistive touchpad and preprocessing, created the CNN model training framework in Python, and set up the CNN inference on the RP2040.
Vaishnavi designed the PCB, and integrated all components on it. Additionally, Vaishnavi designed and experimented with different model architectures and preprocessing methodologies.
Appendix D: References
Datasheets are linked in table above.
OLED LibraryResistive touchscreen Example
Pico tflmicro Library