Introduction
The Active Cooling System (ACS) is an electronics cooling system controlled by a closed-loop controller through an iOS app that enables users to monitor and set temperatures.
We are members of the Cornell Rocketry Team, and part of our challenge is creating electrical systems that are able to withstand the environmental conditions of our launch sites. This summer, we are launching in Midland, Texas, and we will have a box full of our ground support electronics right beside the launch pad for a few hours, exposed to extreme heat. Electronics, especially the Raspberry Pi 5 that acts as the computer for our ground support equipment, are particularly sensitive to high heat and can sometimes behave unexpectedly as a result. We wanted to create an isolated system that could help maintain safe operating temperatures for our electronics, motivating us to develop the ACS.
The ACS utilizes an iPhone, Pico W, BME280 Temperature Sensor, and PWM Fans. This project aims to be as modular and intuitive as possible. As such, it relies on an iOS app to enable user control of the fans. Users can set a desired temperature for each fan and monitor the actual temperature readings from each sensor through a live graphic. We created the hardware setup for these components on a breadboard, utilizing a typical DC outlet as our power source, such that it could easily fit into our existing ground support equipment architecture. We wrote a custom BME280 driver for the Pico to sample the sensor for temperature readings. Utilizing these temperature readings, we use a proportional gain controller to adjust the PWM output of the fans, adjusting to cool the electronics according to a set desired temperature. The ACS combines these components to adjust fan speeds in a closed-loop controller, enabling user control of electronics temperatures.
High Level Design
Rationale
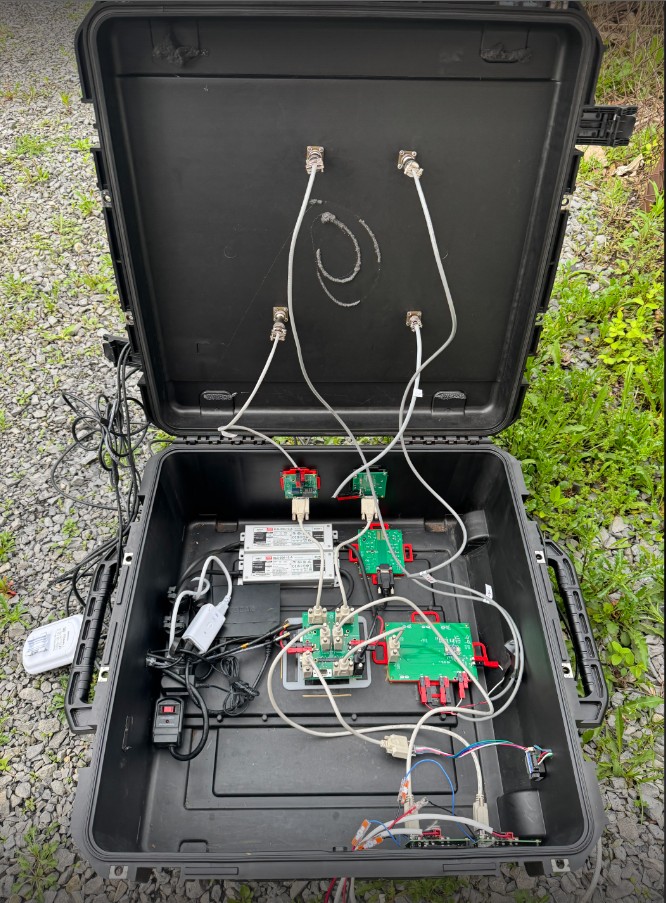
This year, the Cornell Rocketry Team is launching our first-ever hybrid-powered rocket, which means our propulsion system consists of liquid oxidizer and solid propellant. This means that we require robust ground support equipment (GSE) right beside our rocket at the launchpad to remotely control fill operations of the tank on our rocket that holds the liquid oxidizer. The GSE includes what we call the Fill Station, which contains a large box of electronics that routes signals sent from our control software to the relevant hardware, such that we can read sensor data and control valves in real-time. This box is subject to the environmental conditions of our launch sites. Our competition this summer is in an extremely hot desert in Midland, Texas, so we needed a method for cooling these Fill Station electronics in an isolated, modular system that would easily fit into our electronics box and would not require human interaction, since we cannot open the box once we set up all our hardware connections. Below is an image of our Fill Station Electronics.
Structure
Due to the need for a modular, independent cooling system, we opted for a design that relies on a closed-loop controller, communicates over Bluetooth, and utilizes the power source already existing in our Fill Station electronics box. As such, we aimed to minimize physical components as much as possible, so we chose fans that accept PWM signals so that we did not have to convert PWM signals into high and low signals with an optoisolator and MOSFET like we did in Lab 3. We also use a power supply that connects to a typical outlet, as our Fill Station box uses a power strip connected to a portable battery. The hardware lives on a breadboard, connecting the Pico W to three temperature sensors using I2C and two PWM fans.
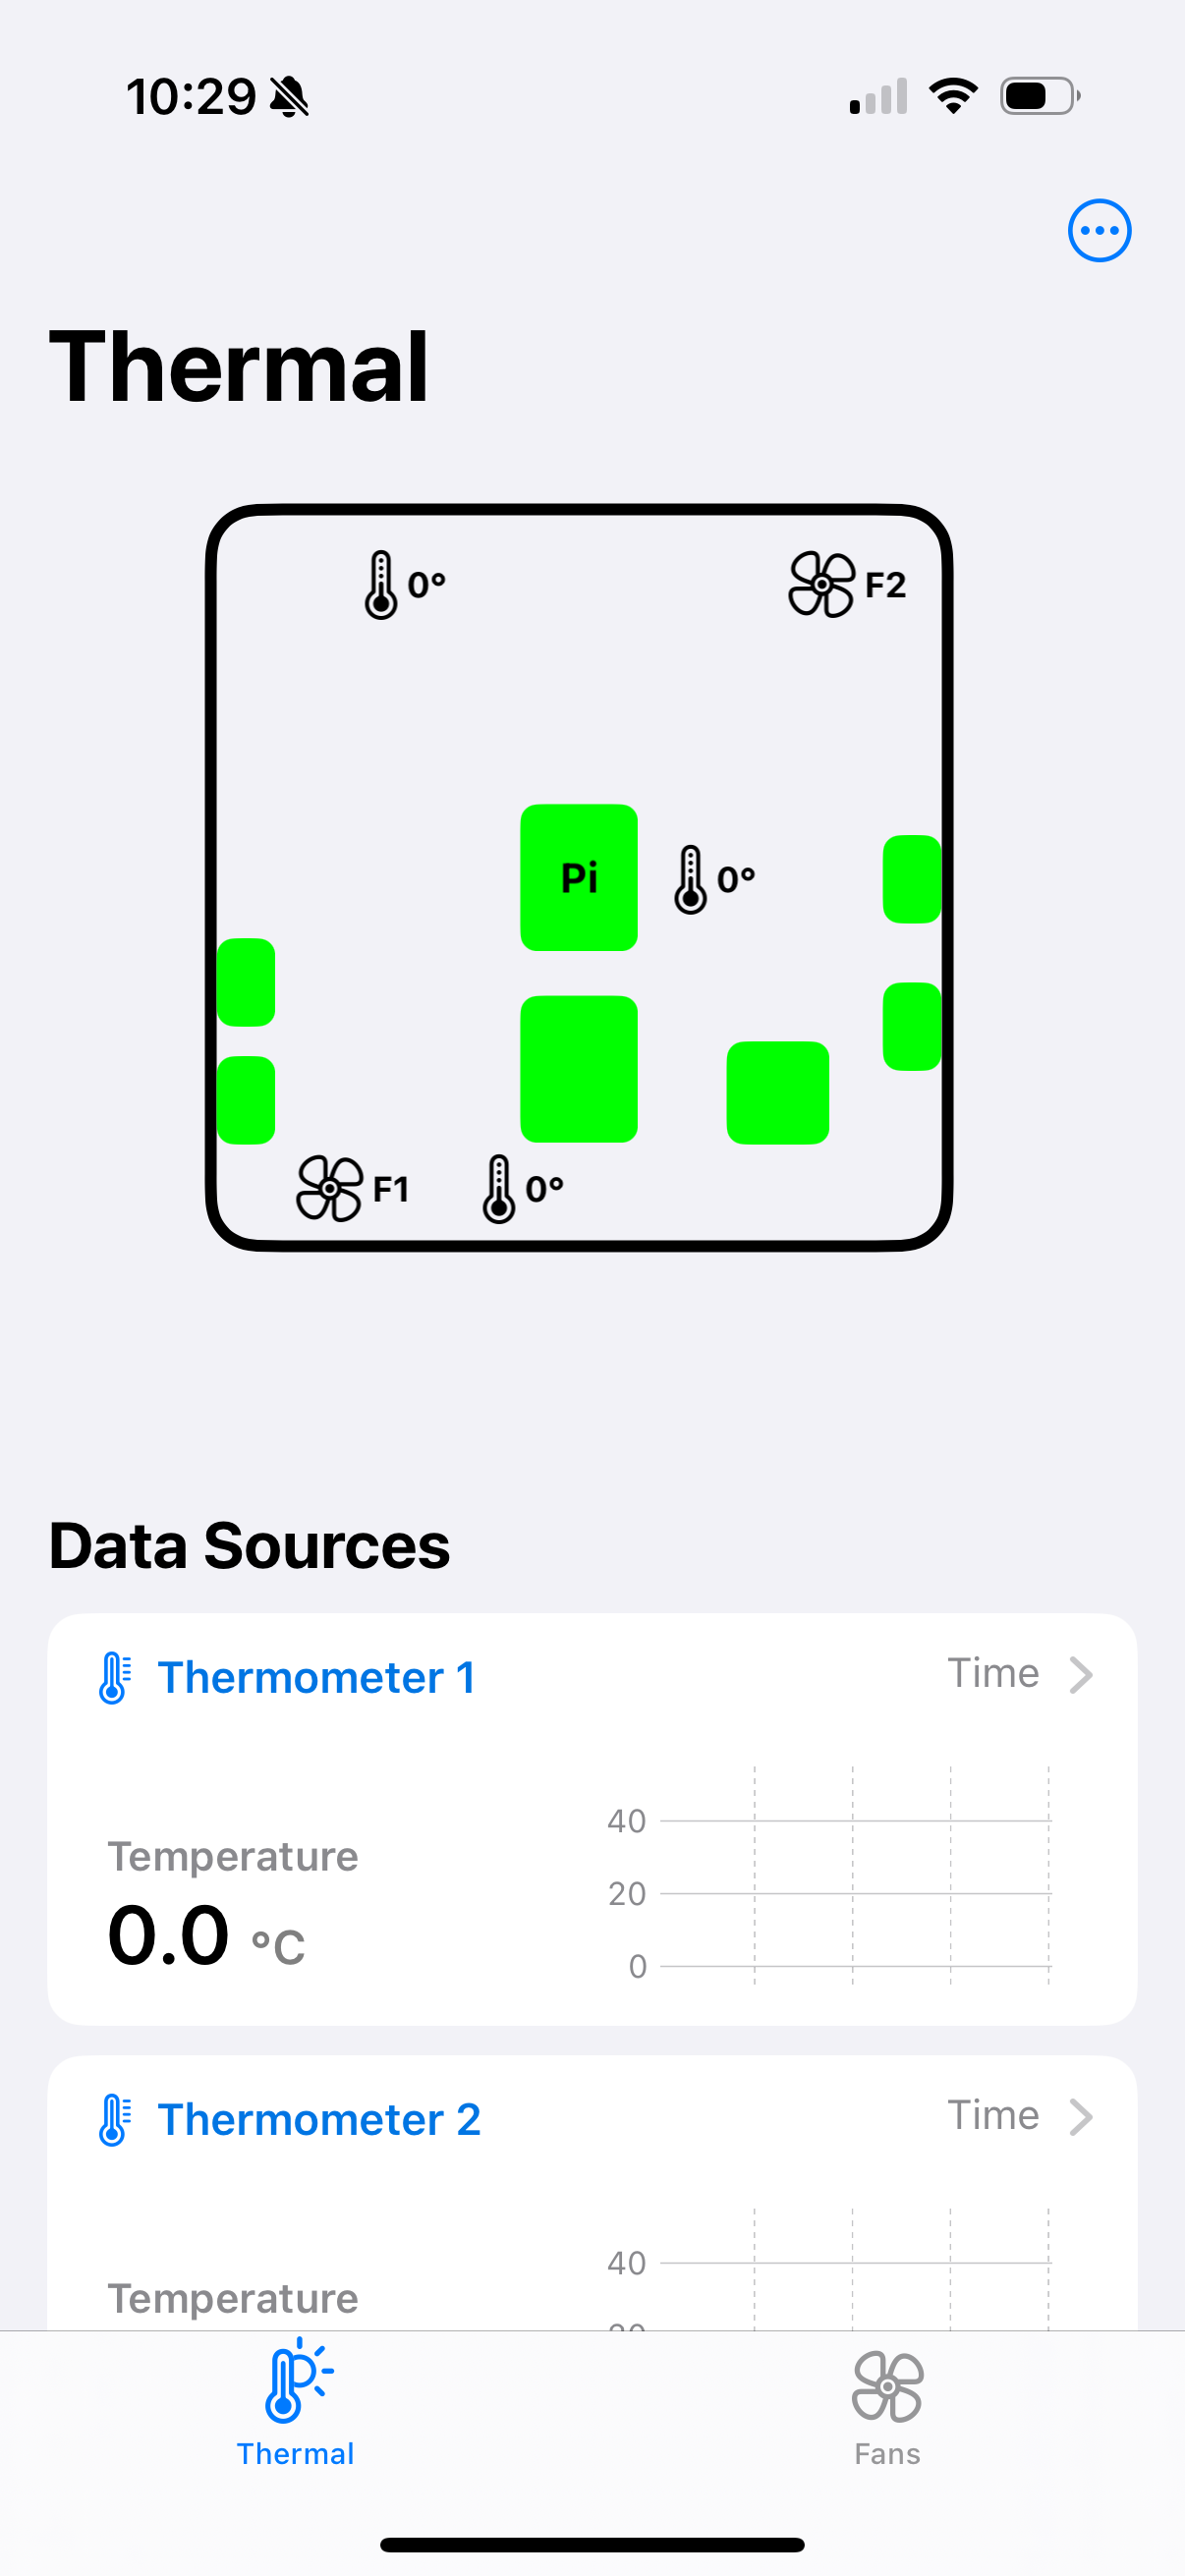
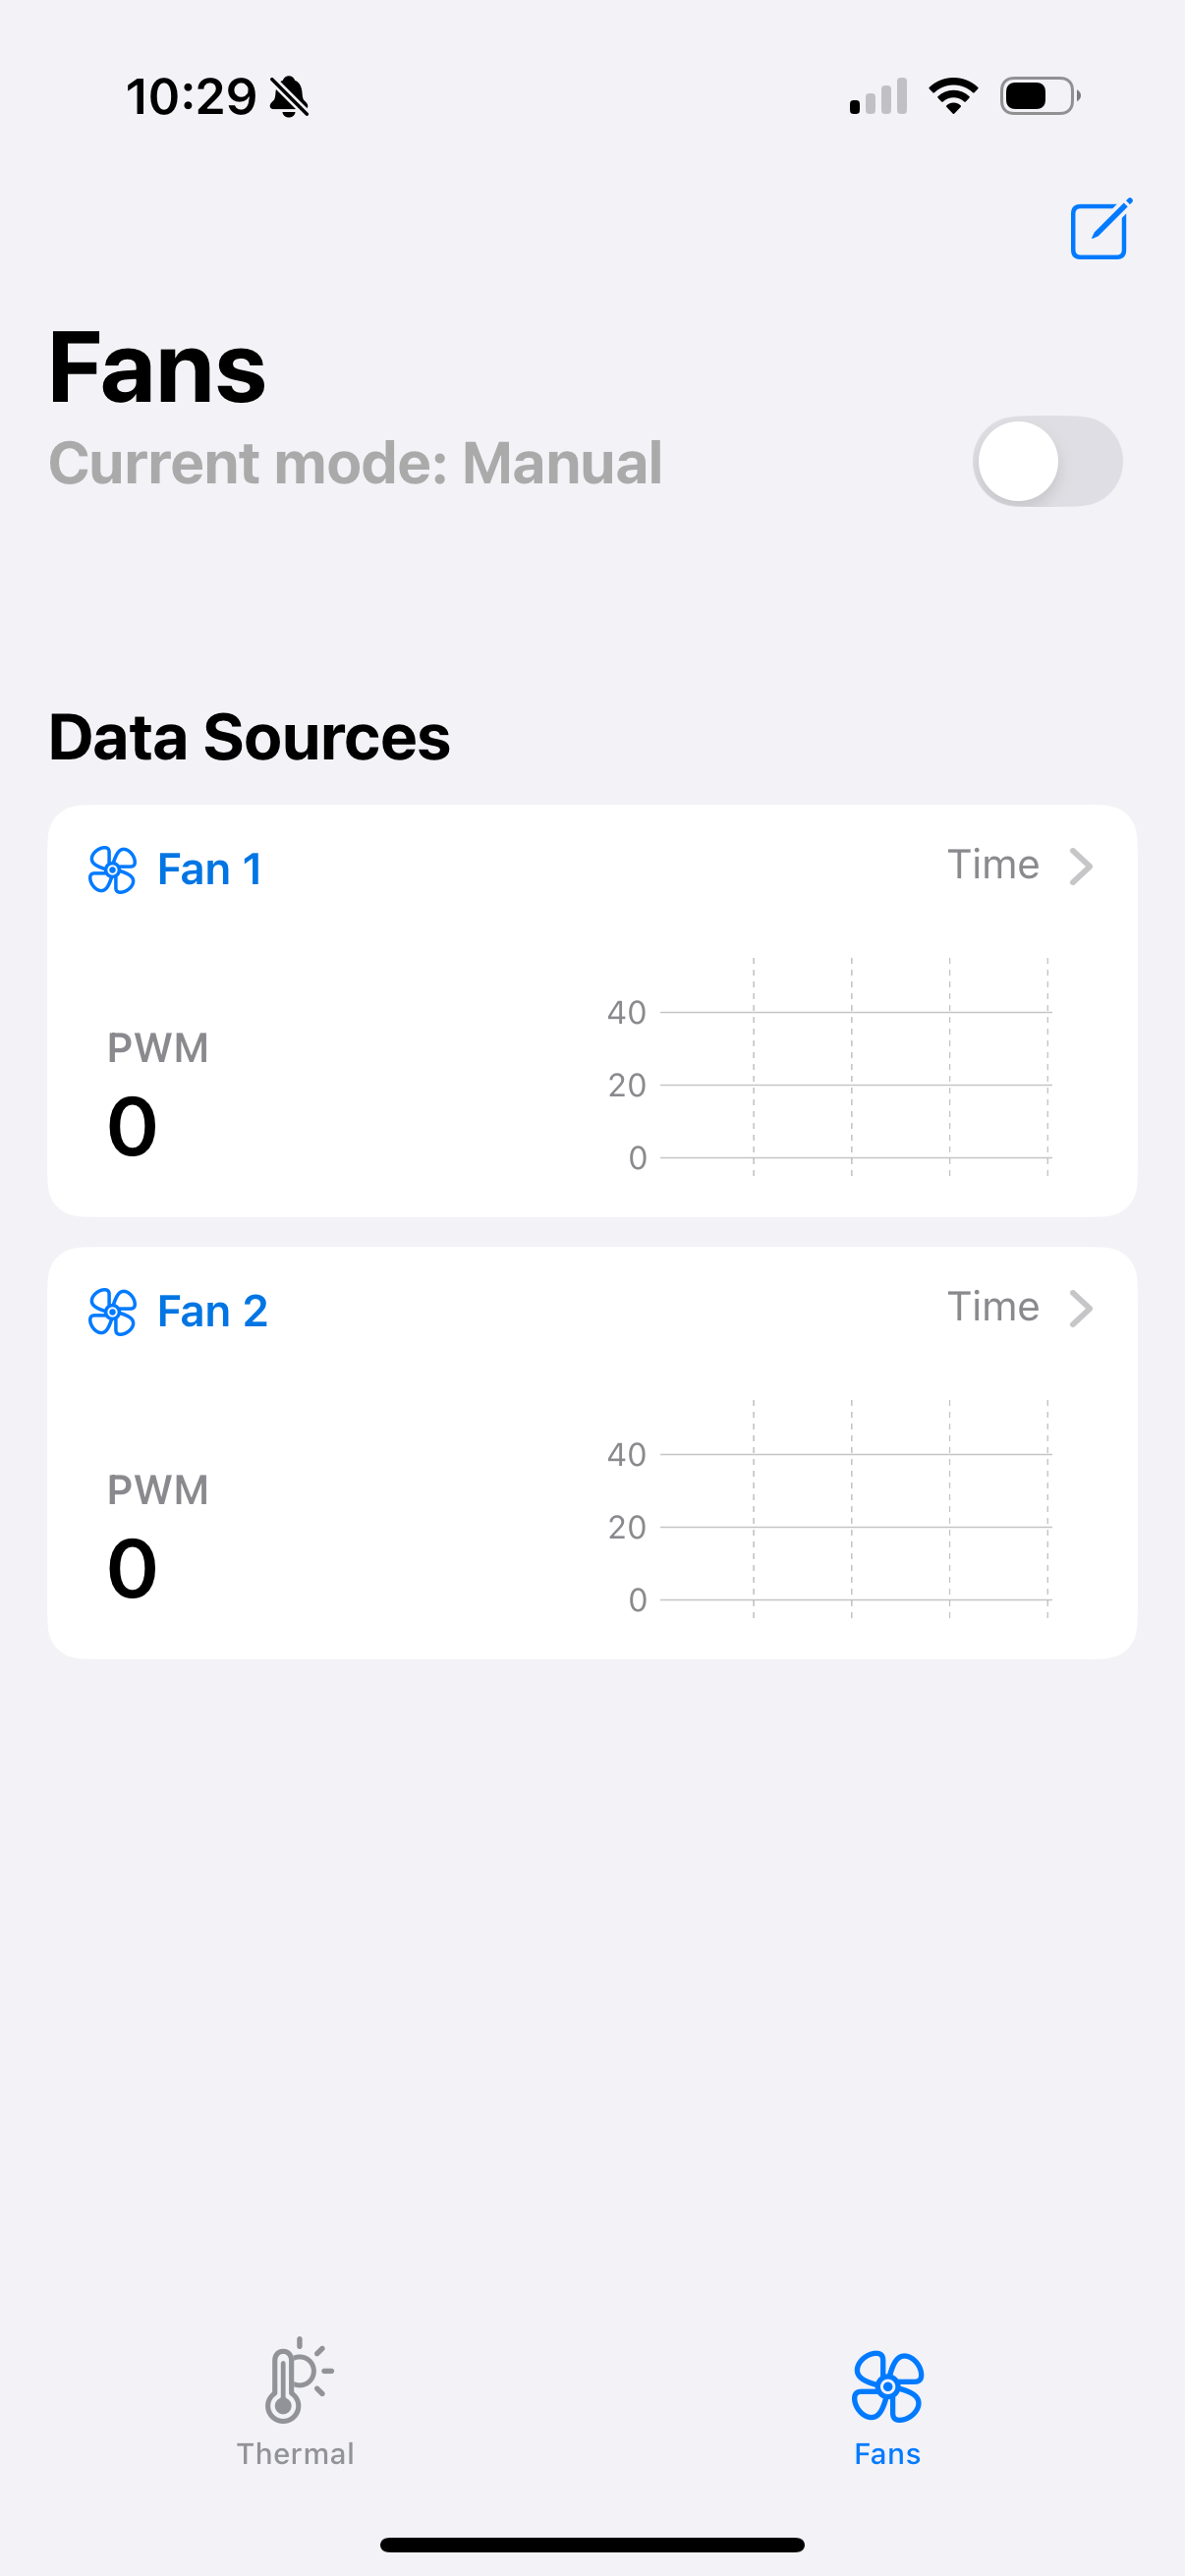
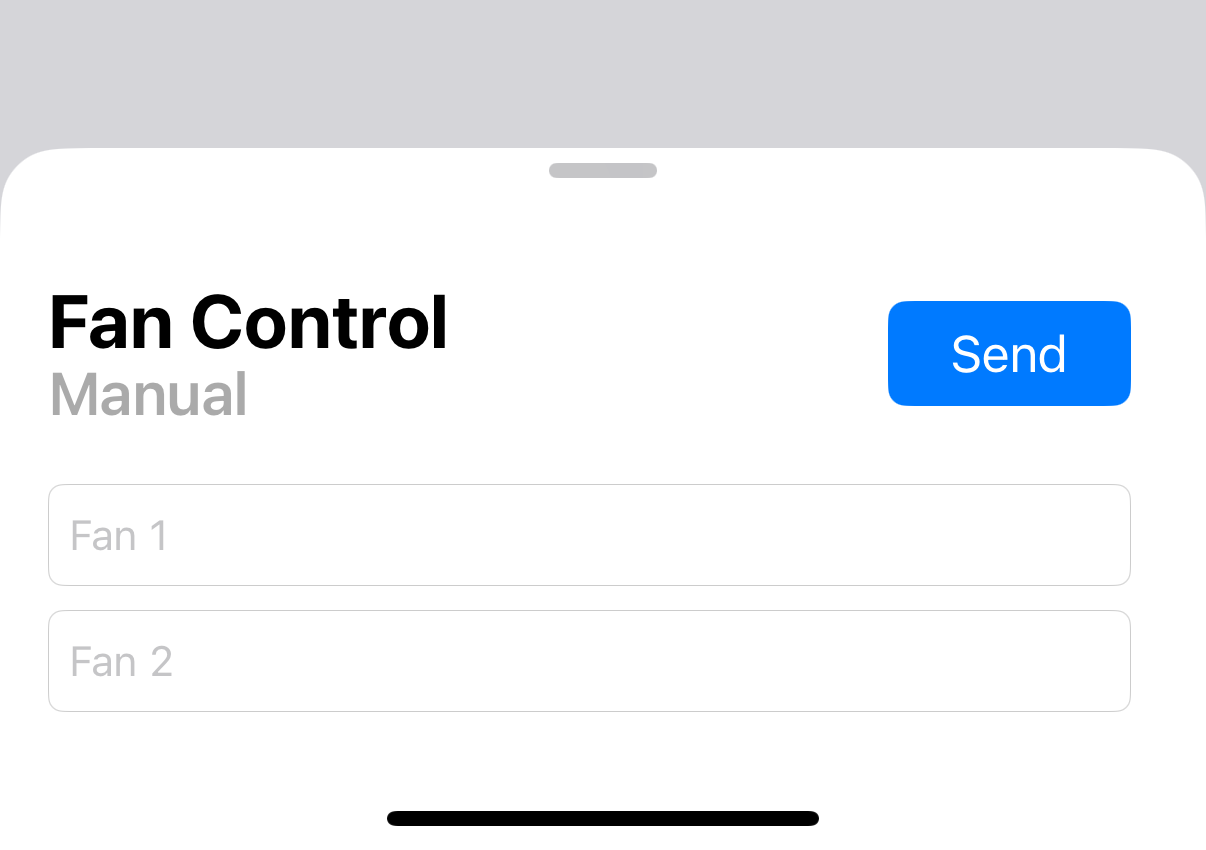
The iOS app enables users to view temperature readings as well as the speeds of the fans, separated into two tabs. In the "Thermal" tab, you can see both a visual layout of the temperature sensors in the fill station box, as well as charts showing the 1 minute history of each temperature sensor. The "Fans" tab also consists of charts showing the 1 minute history of the fans' PWM values, and allows you to switch between the two modes of operation: manual and controller. In manual mode, the user can directly set an inverted PWM control signal for the fans to set each fan to whatever fan speed they would like. In controller mode, the user sets a desired temperature, and the closed-loop controller will constantly read actual temperature sensor readings to adjust the fan speed accordingly such that the desired temperature is reached.
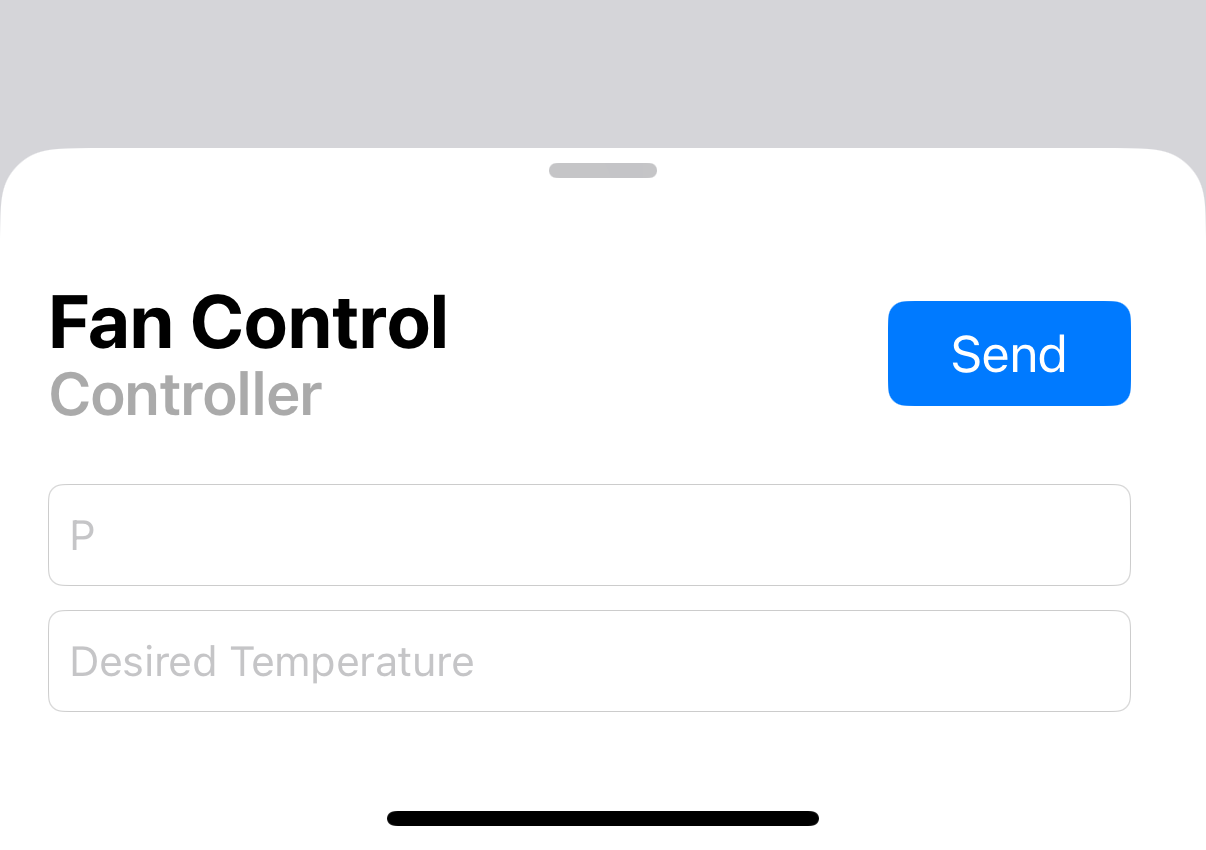
The closed-loop controller is a proportional (P) controller. We chose not to include integrative (I) and derivative (D) control because we are aiming to adjust fan speed to reach the desired temperature as closely as possible, but oscillations near that temperature due to steady state error do not affect the performance in a significant enough way to require the additional control from I and D gains. The user is able to adjust the P gain value from within the app in controller mode.
The software is implemented using two IRQs to handle PWM control signal updates in each fan and a protothread to continuously collect temperature data samples from all three sensors and execute the P controller in the background. The IRQs are in charge of setting flags that signal when PWM signals can be updated. In the protothread, each temperature sensor is polled for new data. If any sensor returns an invalid status, that sensor is disregarded. All valid sensors are averaged, and this reading is used as the temperature reading for the Fill Station box. Then, based on the flags set by the IRQ handler, if the PWM for a fan is able to be updated, the mode that the fan is in is checked. If the fan is in manual mode, the PWM control signal is set based on the received Bluetooth packet. If the fan is in controller mode, the PWM control signal is set by calculating the error between the averaged temperature value and the desired temperature received from the Bluetooth packet and multiplying this by the P gain value, also received via Bluetooth.
Hardware/Software Tradeoffs
The main tradeoff we ran into was with the PWM fans we chose for our project. We chose a fan that accepts PWM signals to simplify the number of hardware components we needed, as this ensured that our physical breadboard setup was minimal and had less room for wiring issues. However, we had some difficulty finding fans that took PWM signals, especially since we were hoping to find a fan that could take 3.3V logic-level signals. Through testing, we found out that the one we chose actually needed a 5V logic level despite the datasheet suggesting it could work with 3.3V, so we added a logic level shifter to our breadboard. The software tradeoff with this PWM fan, we found through testing, was that when powered, this PWM fan cannot completely stop spinning. This means that if our desired temperature is above the current temperature, and we send a PWM signal that would correspond to a fan speed below the fan speed that the PWM fan sets to on power, then the fan cannot decrease its fan speed. In the future, we would hope to select a fan that has the ability to decrease fan speed all the way to zero.
Patents/Copyrights/Trademarks
There are no existing patents, copyrights, or trademarks relevant to our project. All software we referenced and utilized are under open source licenses.
Hardware Design
In order to implement our PID controller, we selected the BME280 Temperature sensor and a PWM Fan as an actuator for cooling. We chose to use three temperature sensors. In case one sensor had invalid readings, an average of the other two could be used. Here, we ensure that our controller is always fed valid temperature readings, operating off of real-time data, rather than past data, even if one of the sensors does not work. Additionally, using three sensors allows us to spread out our sensors across the Fill Station, getting temperature readings from different areas. We chose to utilize two fans, believing that two fans would have enough power to cool the entire Fill Station Electronics Box. However, if we wanted to add additional fans, our current system architecture accounts for that possibility, since we have numerous unused GPIO PWM pins on the Pico W. Below is an image showing our overall system architecture.
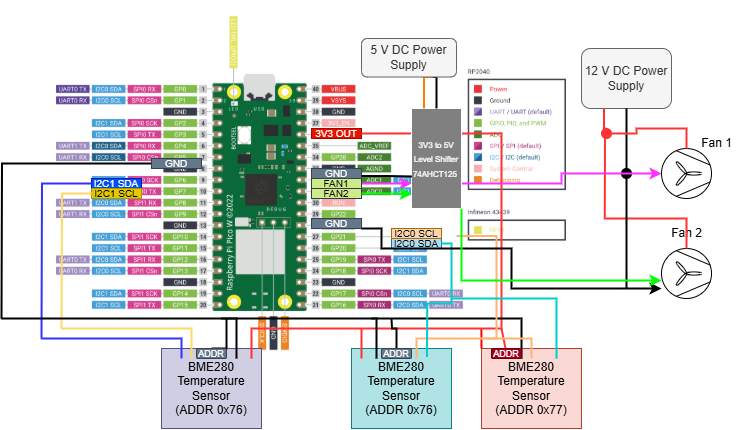
The diagram shows that two temperature sensors exist on the I2C0 bus, while one exists on the I2C1. This is because the BME280 can have two different addresses, depending on whether the ADDR pin is pulled high to 3V3 (0x77) or low to GND (0x76). Therefore, two BME280 sensors can exist on the same I2C bus.
The fans are given power from an external 12 V DC power supply, and are driven by 5V logic level PWM signals. Although the datasheet stated that any signal above 2.8V could actuate the fans, through testing, we realized that a 3.3V PWM signal was too close to the threshold and could not actuate the fans. Since the logic-level output for a Pico is 3V3, we need to level-shift this output. For this, we utilized a 74AHCT125 level shifter/inverter, connecting a 5V DC outlet to the level shifter, 3V3 and GND from the Pico, as well as the PWM signals. This gave us the correct operating conditions.
To actuate the fans using the Pico, we utilized an interrupt handler, similar to what we did in Lab 3. Here, we utilized a global interrupt handler for both PWM pins, setting flags for each PWM pin. These flags are taken as conditionals in our main protothread, protothread_temp , which is checked after polling for temperature data.
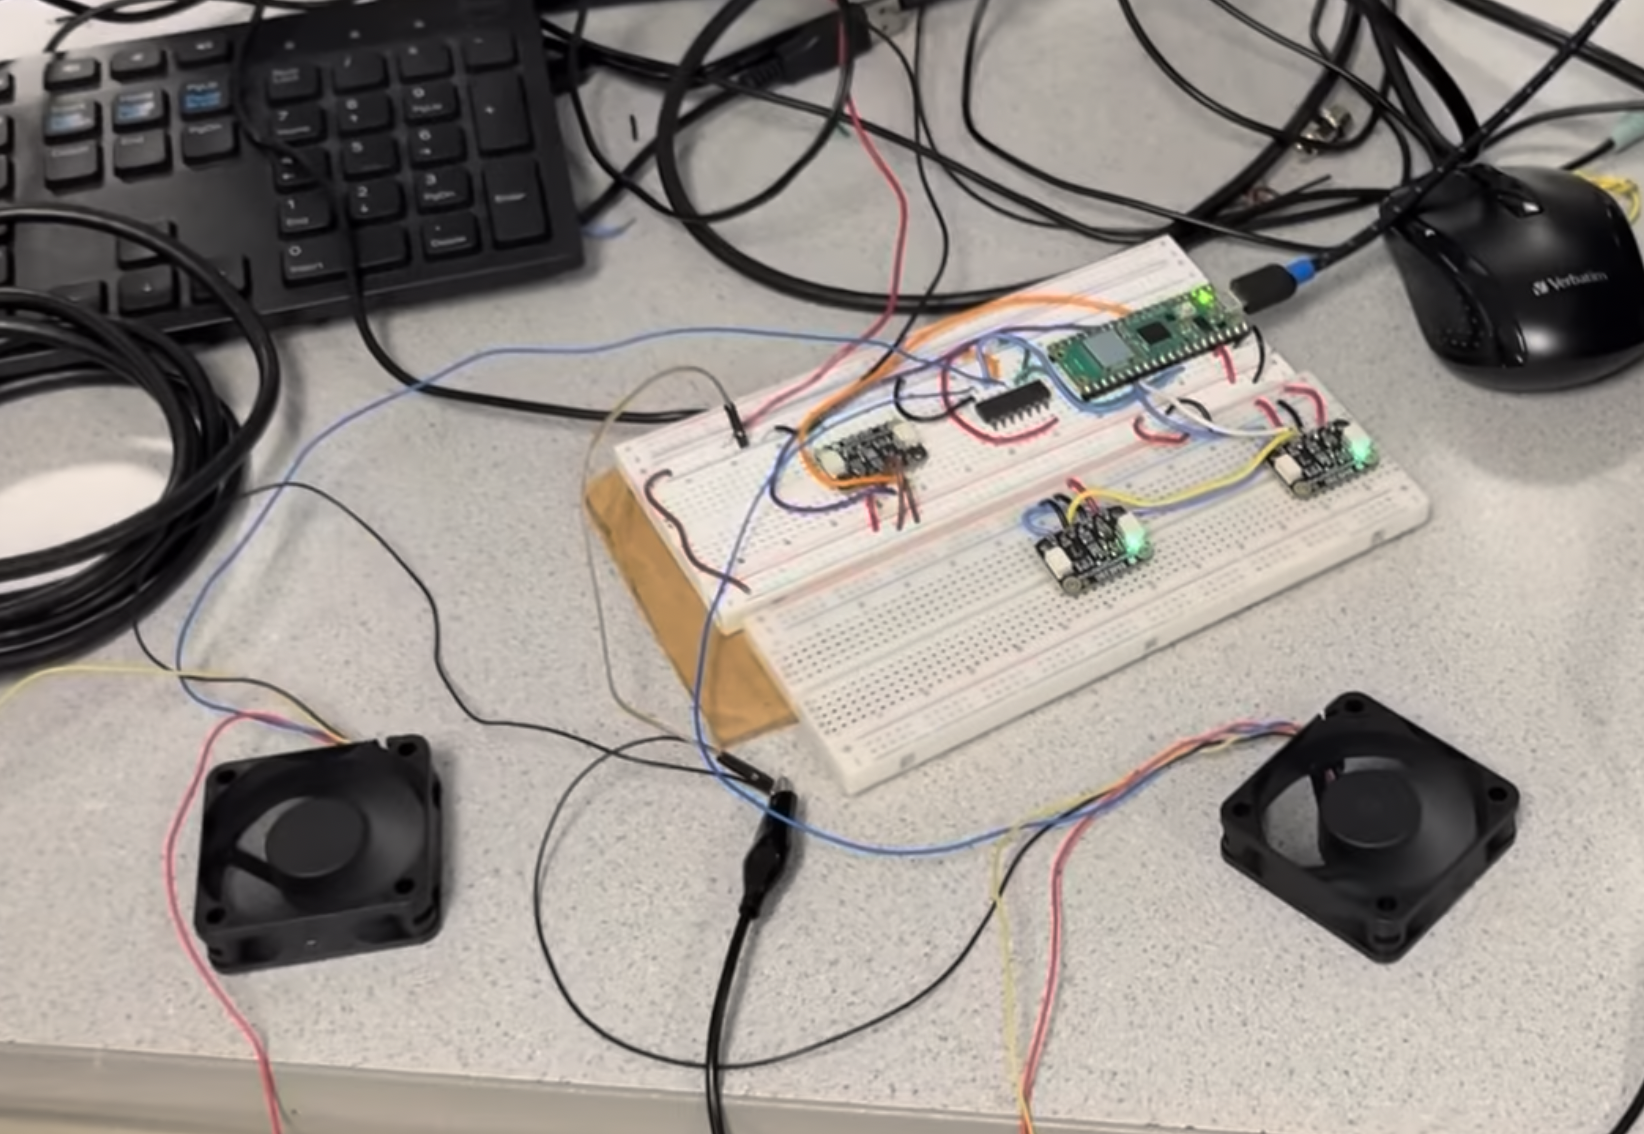
Below is an image of our final hardware setup, with our three temperature sensors, level shifter and two fans, as well as the Pico W.
Software Design
Pico
Data Polling
We gather data from the three BME280 temperature sensors using a custom driver for the Pico to communicate with the sensors. The BME280 is a temperature and humidity sensor manufactured by Bosch Sensortec, and Bosch provides an API to use with it. We also referenced an Adafruit library created for the Arduino for the Adafruit breakout board containing the BME280. Utilizing the Bosch API meant that the API handled the low level processes within the sensor itself, and we were primarily responsible for writing functions for I2C communication with the Pico. To use the driver, a user calls on the begin() function to configure the BME280 with necessary settings and also perform certain checks to make sure the sensor appears on the I2C bus and the settings successfully wrote to the sensor. Then, the user can call read_temperature() which collects 50 temperature reading samples and averages them to create a sample that gets rid of excess noise.
In our original proposal, we also planned to include a thermal camera to provide the iOS app user with an additional form of visualization for temperature data from within the Fill Station box. We chose the AMG8833 thermal camera for this and created a custom driver to communicate with this sensor over the Pico. To create this driver, we referenced the AMG88xx driver created by Adafruit for Arduino for their breakout board for the sensor. A user similarly calls on a begin() function to initialize the sensor with needed settings. Then, the user calls on read_pixels() to sample a temperature reading from each pixel out of the 64 pixels that the camera reads, storing these results in an array. After this, the user can call convert_to_heatmap(), which takes the array storing temperature readings and converts these into an RGB value, storing these results into another array. This results in 64 RGB values that can be used to display a heatmap view from the thermal camera. The highest resolution version of this heatmap is memory intensive, requiring 192 bytes to store 64 RGB values. To optimize this for storage, and to stay within bounds for Bluetooth packet length, we limited the number of possible RGB values, by using RGB332, which is a sample of 256 RGB colors that utilizes only 3 bits for R, 3 bits for G, and 2 bits for B, such that an entire RGB332 value only takes one byte. This decreases the size of the array of color values from 192 bytes to 64 bytes. To utilize this feature, a user can call convert_to_heatmap_RGB332().
Communication with App
The Active Cooling System has two modes: a manual mode, where the user can set the PWM of the fan, and a controller mode, where a P controller is implemented to automatically control the fans to cool the system to a desired temperature. The desired temperature, as well as the proportional constant, can be set by the user in controller mode. The mode that is set is also a characteristic that is communicated to the Pico.
In order to implement this structure, we needed to implement GAP Advertisement and GATT Service routines. In the GATT Service routine, we had a .gatt file that initialized the different characteristics as read-only or read and write without response. Any characteristics that the user could control were set as read and write without response, while temperature data was set as read-only. In the GATT header file, we initialized the required handles and communication IDs, as well callback functions for each characteristic. These callback functions were utilized to update temperature sensor readings, as well as handle user-controlled characteristics, handling writes to and from the app. The GAP Advertisement header file handled formatting packets for proper bluetooth transmission. The GAP Advertisement header, as well as the initial formatting for the GATT service routine were taken from Hunter Adams’ example code from the 4760 website.
Manual Mode
In manual mode, the PWM output is sent from the app to the Pico W. The Pico utilizes the callback function from the service handler in order to change the state of the fans, as well as their state on the app.
Controller Mode
This mode implements an automated P controller. The user sets a desired temperature value in Celsius. This is then utilized in an error calculation, where the error is the difference between the desired temperature and the measured temperature from the BME280. This measured temperature value is an average of the value measured between the three sensors. If there are invalid sensor readings, the program averages only the valid readings. This way, if one sensor fails, the controller is able to still function. This error is then multiplied by the proportional constant, known as Kp, which converts it to a PWM/duty cycle output. This Kp can be set by the user, but it takes a default value of 100. This value was tuned based on rigorous testing, where higher Kp values ended up saturating our controller to the maximum threshold, and lower Kp values were not cooling the system at an optimal rate. We determined that P-control, without the derivative or integral terms, was sufficient enough for our purposes, since we did not require minimal overshoot and saw a steady state temperature that was close enough to our desired temperature. If the user wants the desired temperature to be reached faster, they can increase the Kp on the app, which automatically sets the Kp value on the Pico W or controller interface.
iPhone App
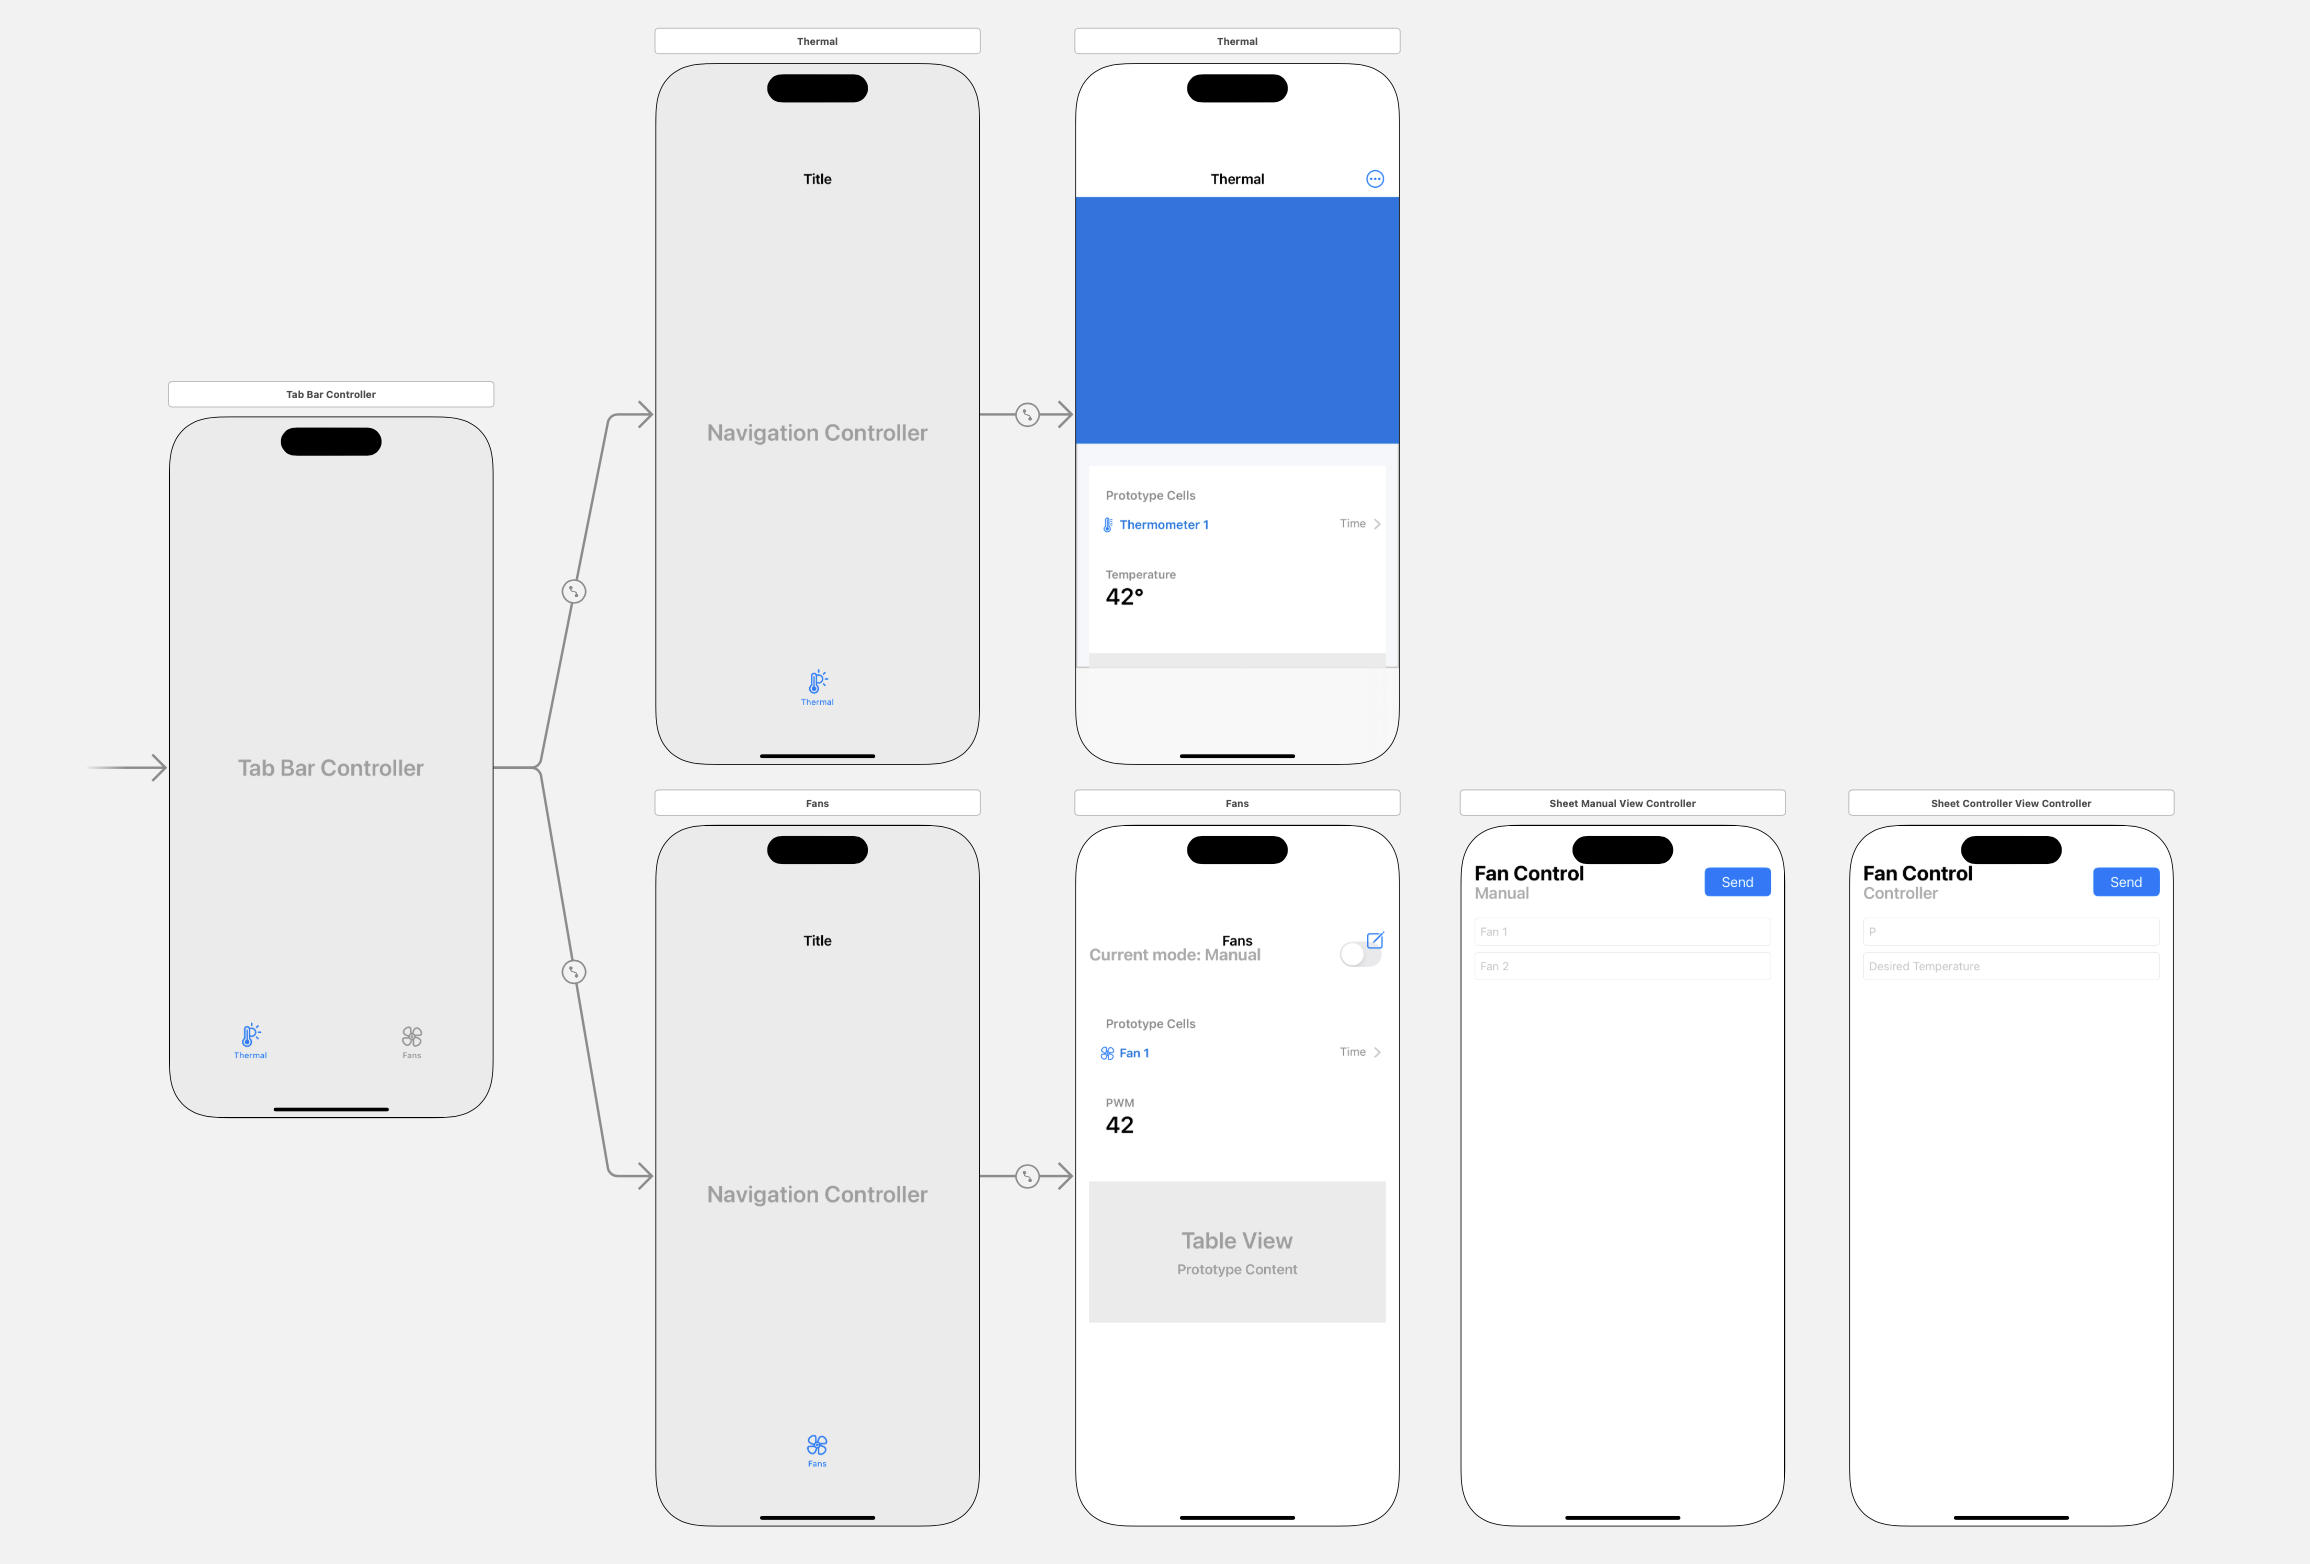
The app was built in Xcode using Swift, a language created by Apple specifically for development on their platforms. To maximize usability, the frontend was built first so we could see and iterate upon how the data was going to look to the user. I chose to build the frontend using Xcode’s storyboard feature, in which you can lay out all user interface elements visually onto a mock iPhone screen, which eliminates a lot of the pain and tedium of doing it through code only. As each view has its own storyboard, there is one for the thermal view, fan view, and the fan control windows. Each of these views has its own view controller class which manages, via Swift code, how the view responds to user interaction and dynamic data. Here, I store things like backing arrays for the charts of data, or other things like button states. Every iOS app is rigidly structured according to the Model-View-Controller paradigm, so there is not a whole lot of freedom to custom design the software architecture.
For the backend, the majority of the functionality came from implementing the Bluetooth interface. Apple provides many native libraries for interacting with the iPhone’s hardware, such as the Core Bluetooth package for its Bluetooth modem. Using this package, I created a BluetoothManager singleton class which extends from two important Core Bluetooth packages: CBCentralManagerDelegate and CBPeripheralDelegate. CBCentralManagerDelegate allows the app to manage scanning for and connecting to nearby Bluetooth peripherals, while CBPeripheralDelegate handles events related to the connected peripheral, such as discovering services and receiving data from characteristics.
To extend from these two classes, you must implement a set of required methods to specify things like which primary service to look for and which characteristics to process. The vast majority of Bluetooth functionality for the app came from implementing these methods. One of these methods, didUpdateValueFor, is called whenever a known characteristic is updated. Thus, if, for example, a new temperature reading on thermometer 1 is received, I update the backing data array for the thermometer 1 chart and refresh the UI for that chart specifically, enabling automatic UI updates as new Bluetooth data comes in.
When the app is opened, the BluetoothManager class is initialized and no additional configuration is required from the user.
Results
Fan Actuation Testing
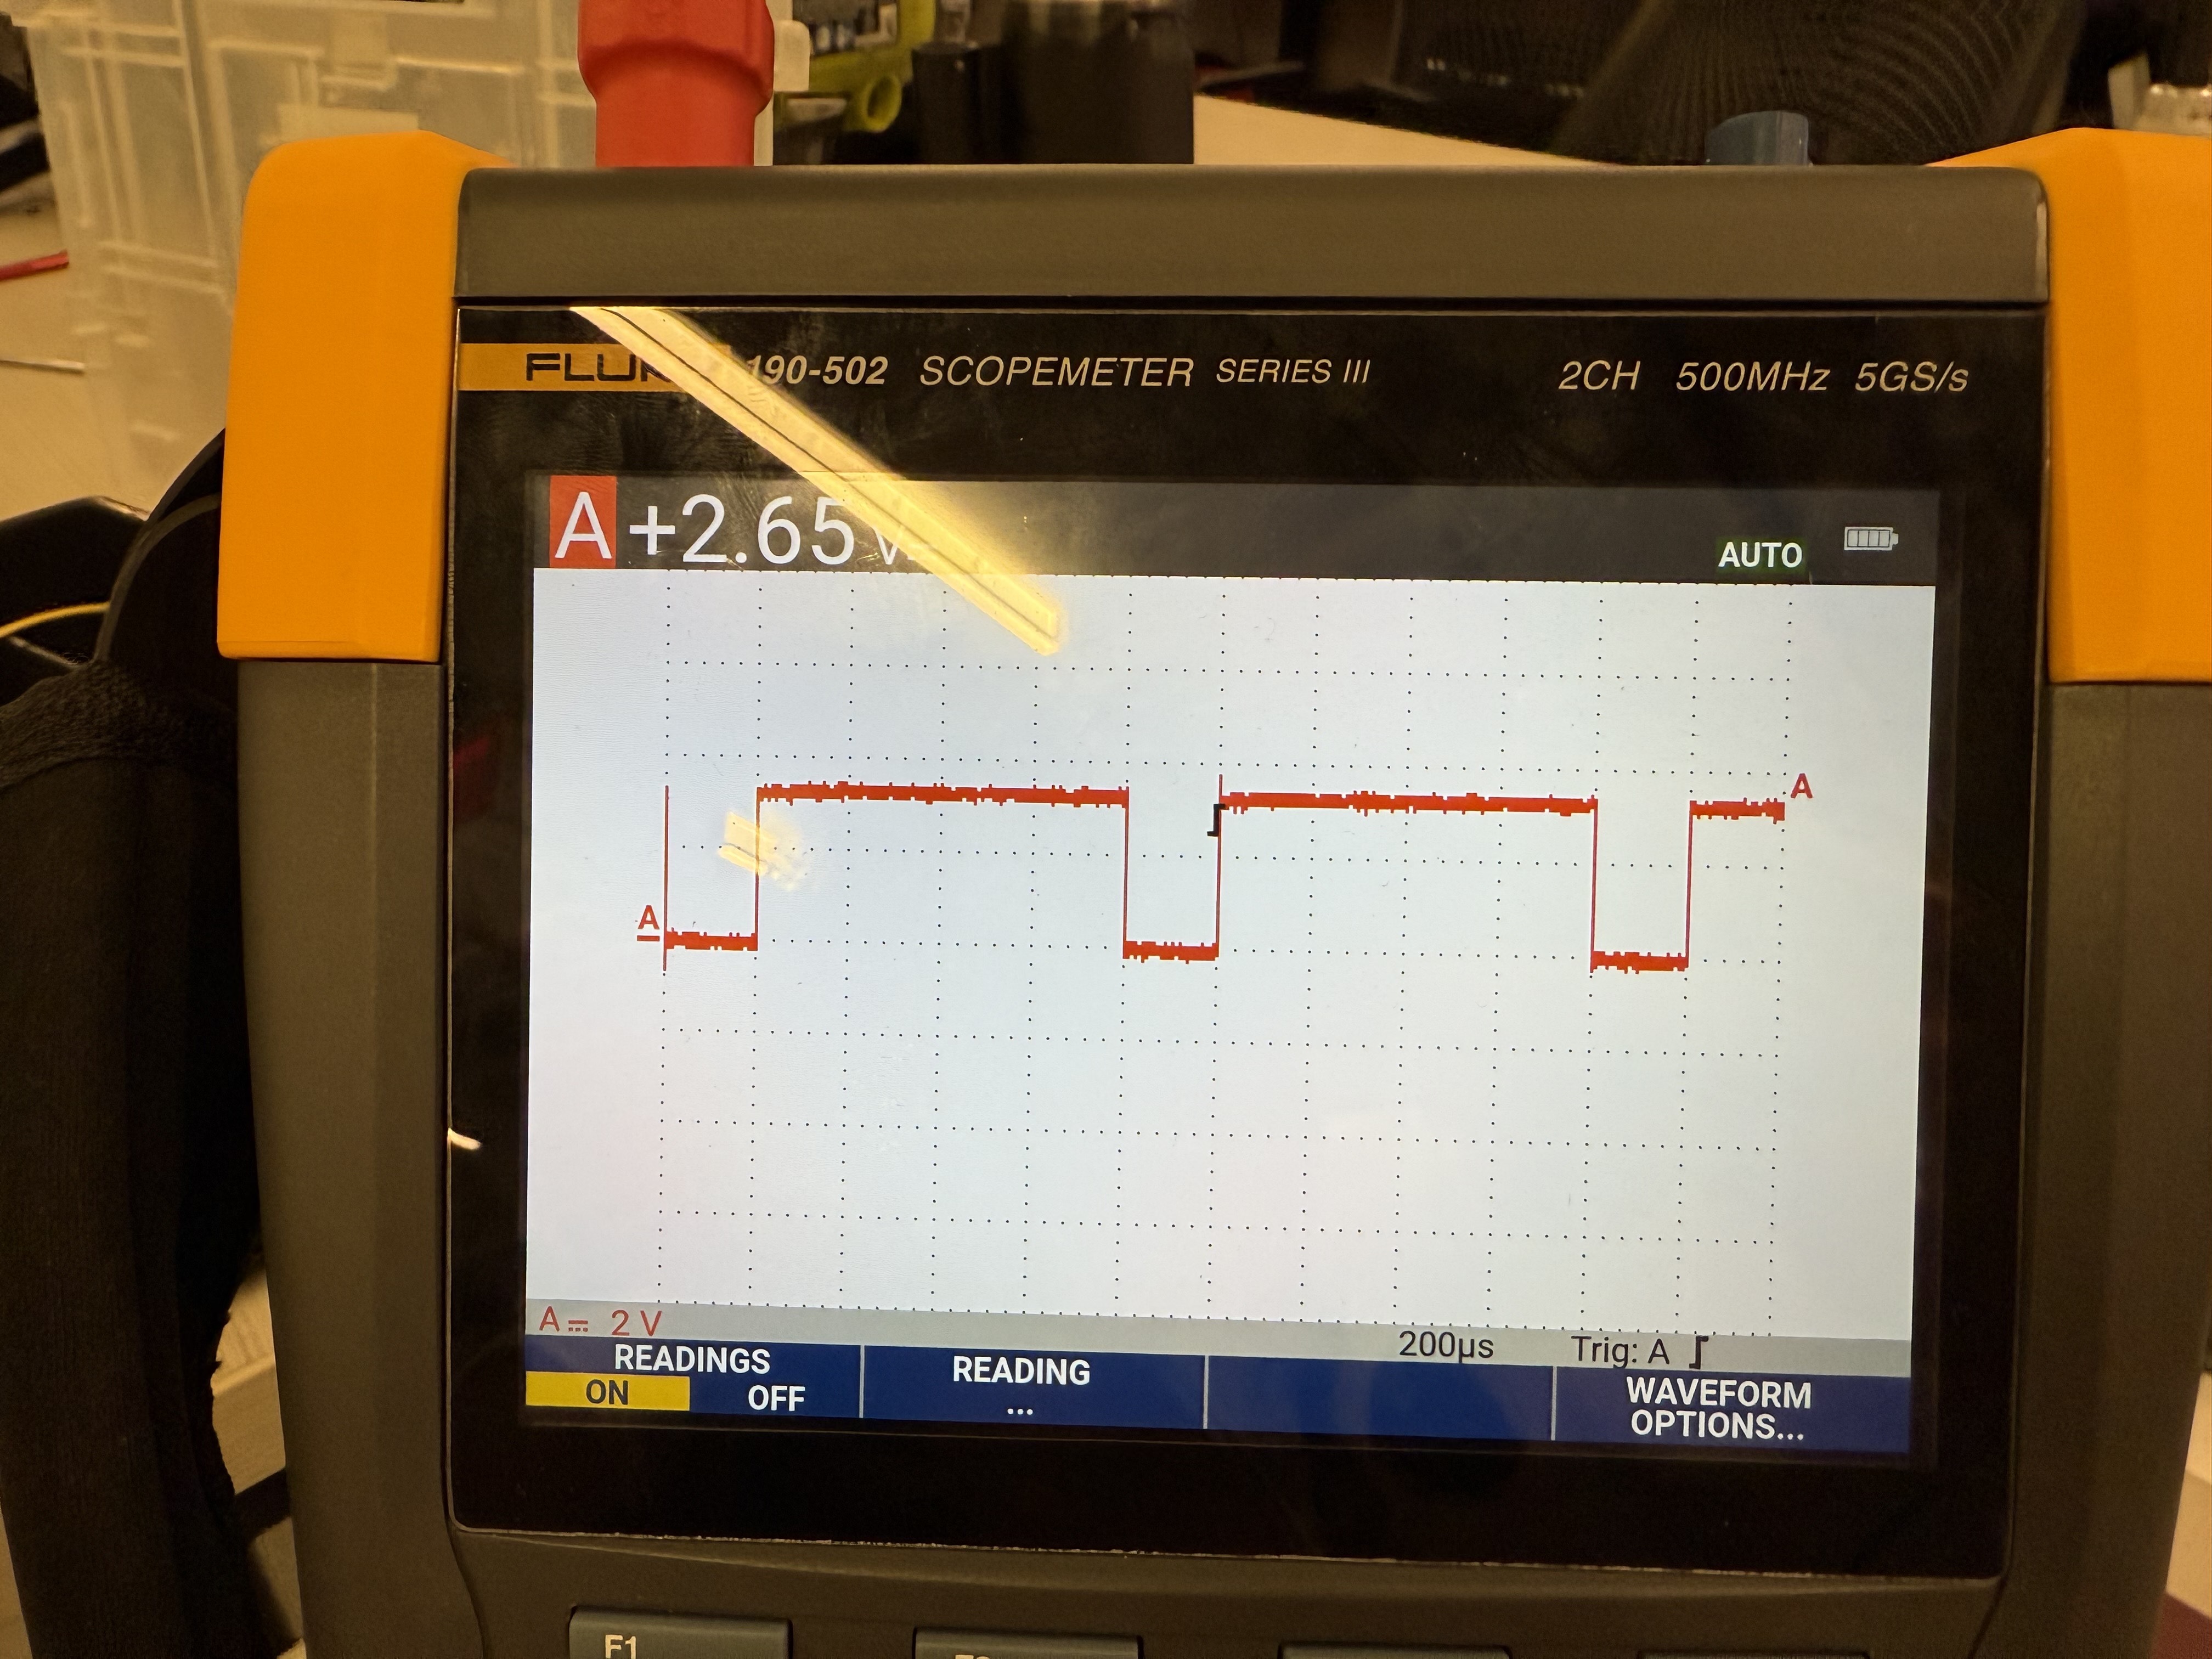
In order to initially verify that the fans were receiving the correct PWM values, we utilized an oscilloscope to probe the PWM output pins, Fan1 and Fan2, which were GP27 and GP26, respectively. Below is a scope image of PWM value 1000, directly from the Pico side.
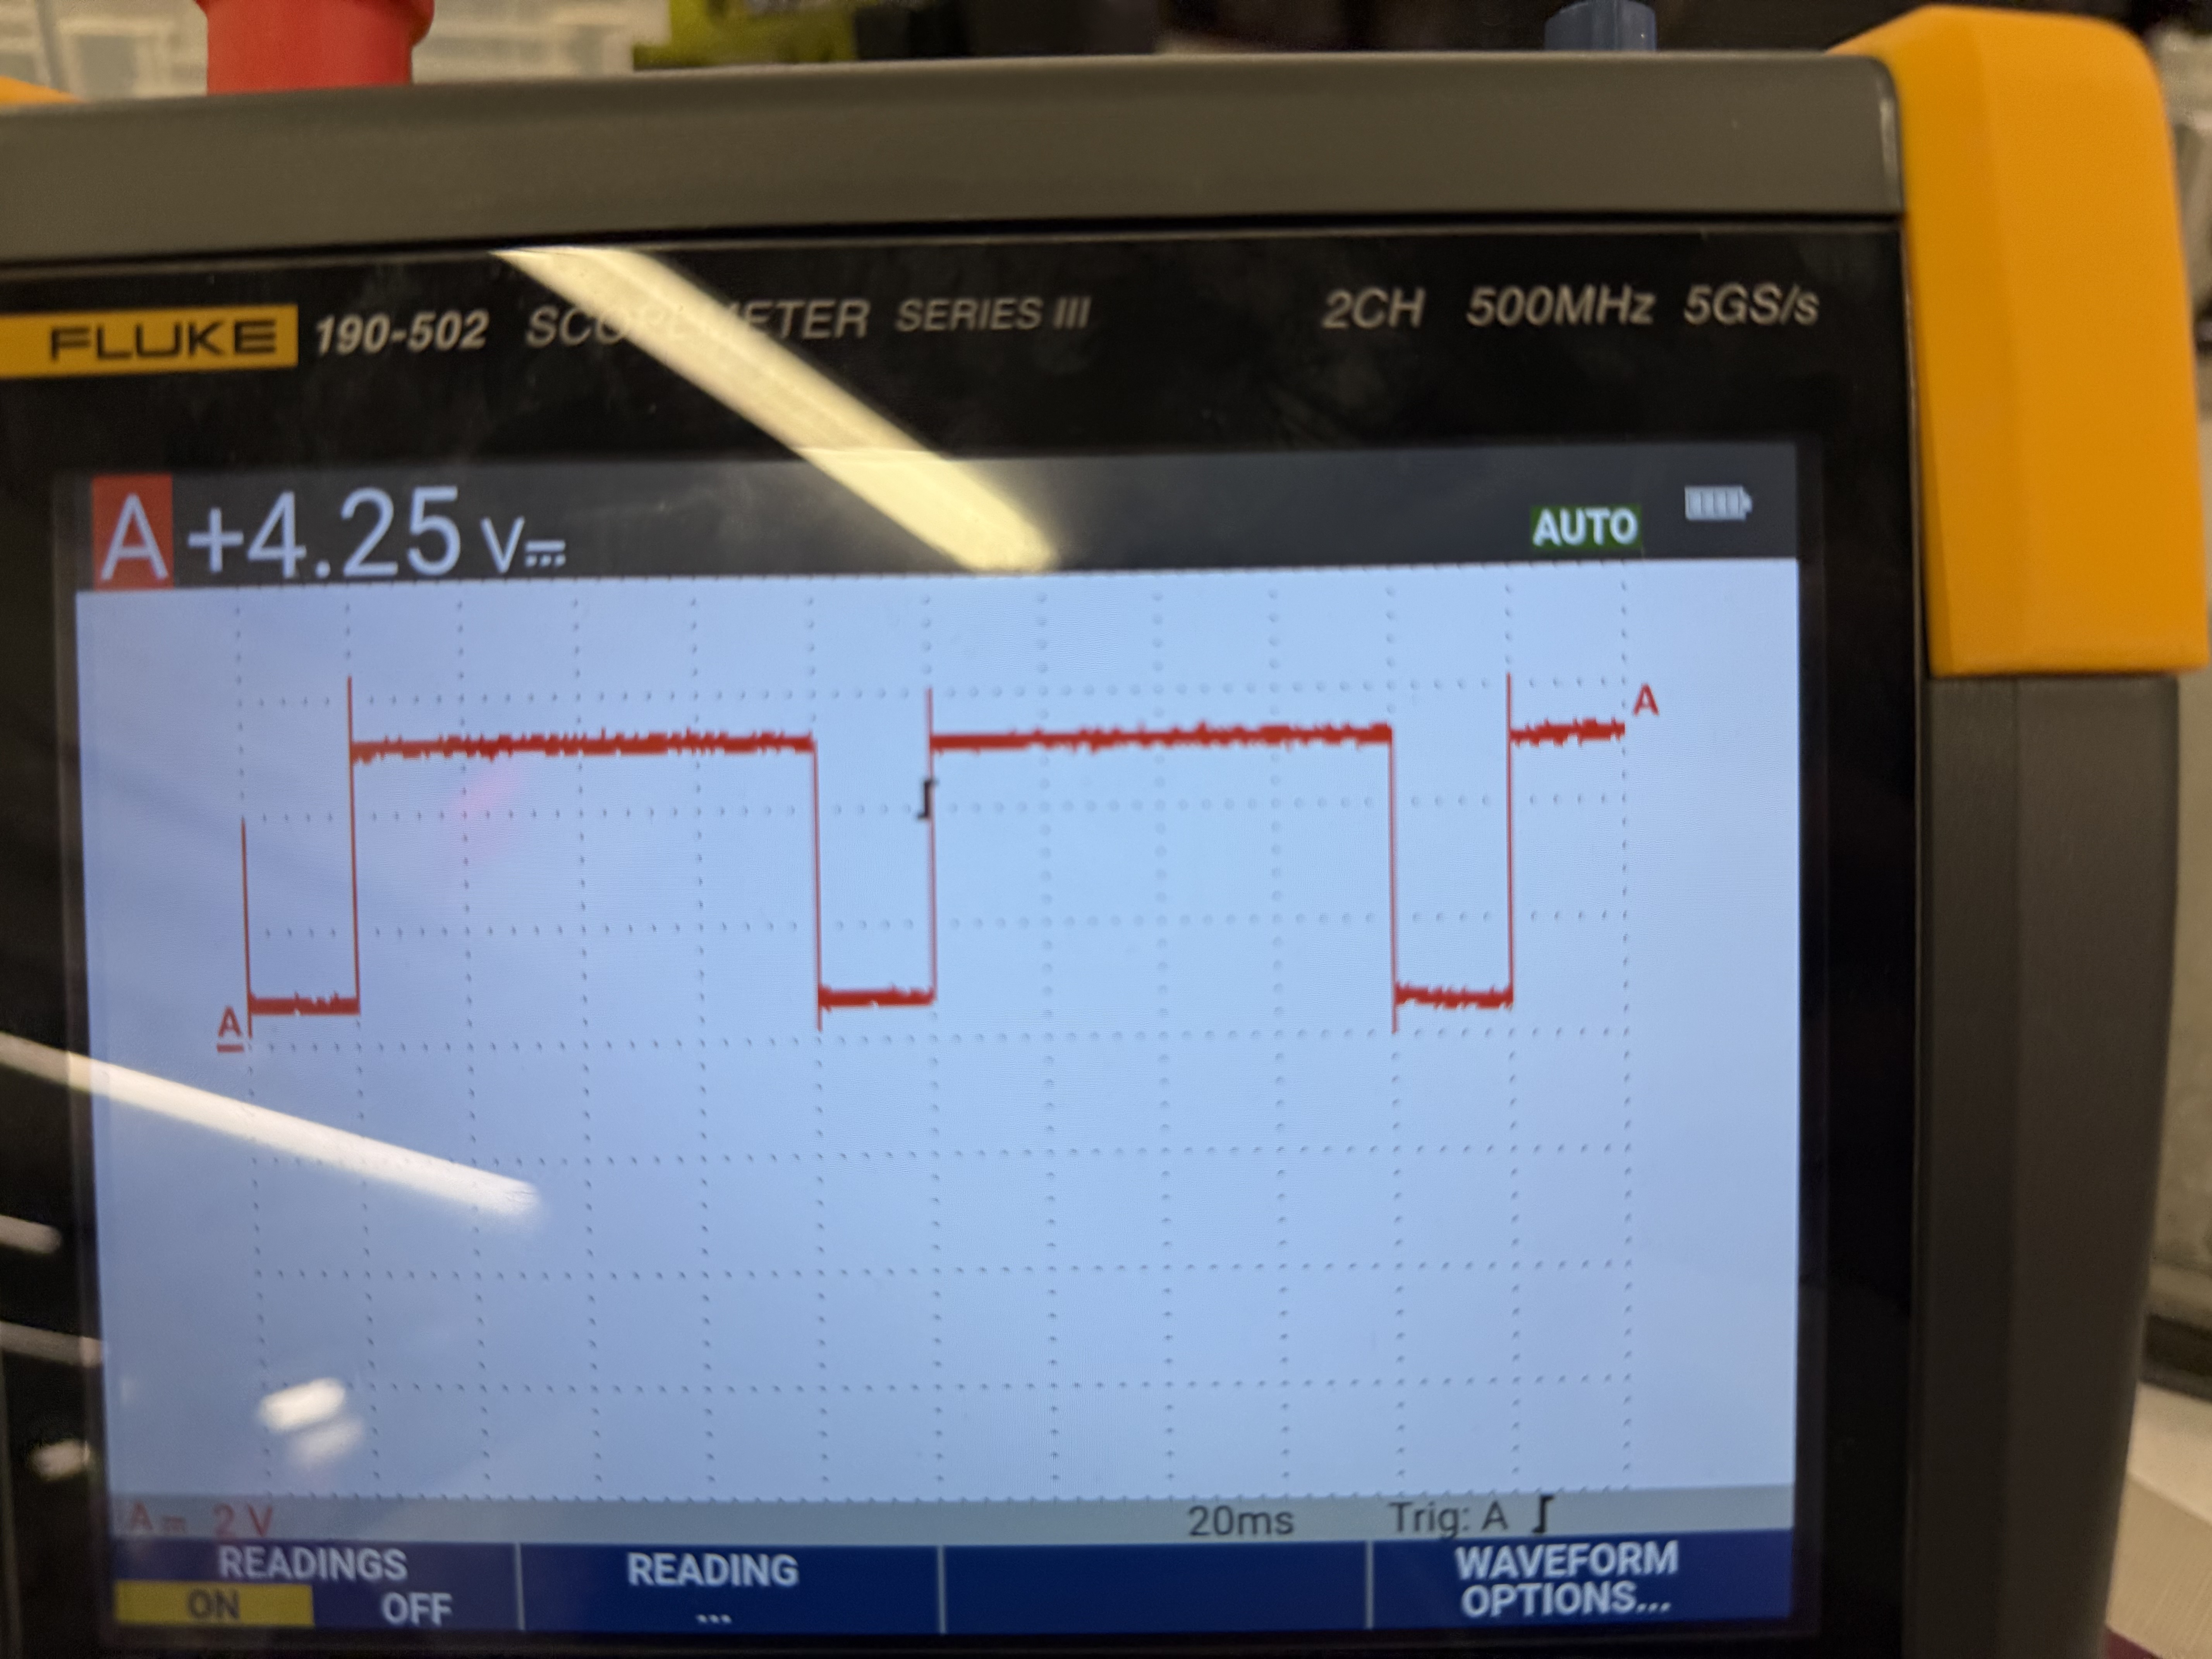
We also wanted to ensure that the PWM signal is properly being propagated across the level shifter. Here is the same PWM value of 1000, but on the other side of the level shifter. Here, we deemed that our level shifter worked as intended since the signal looked as if it had the inverted duty cycle as the 3V3 signal, since our level shifter was also an inverter.
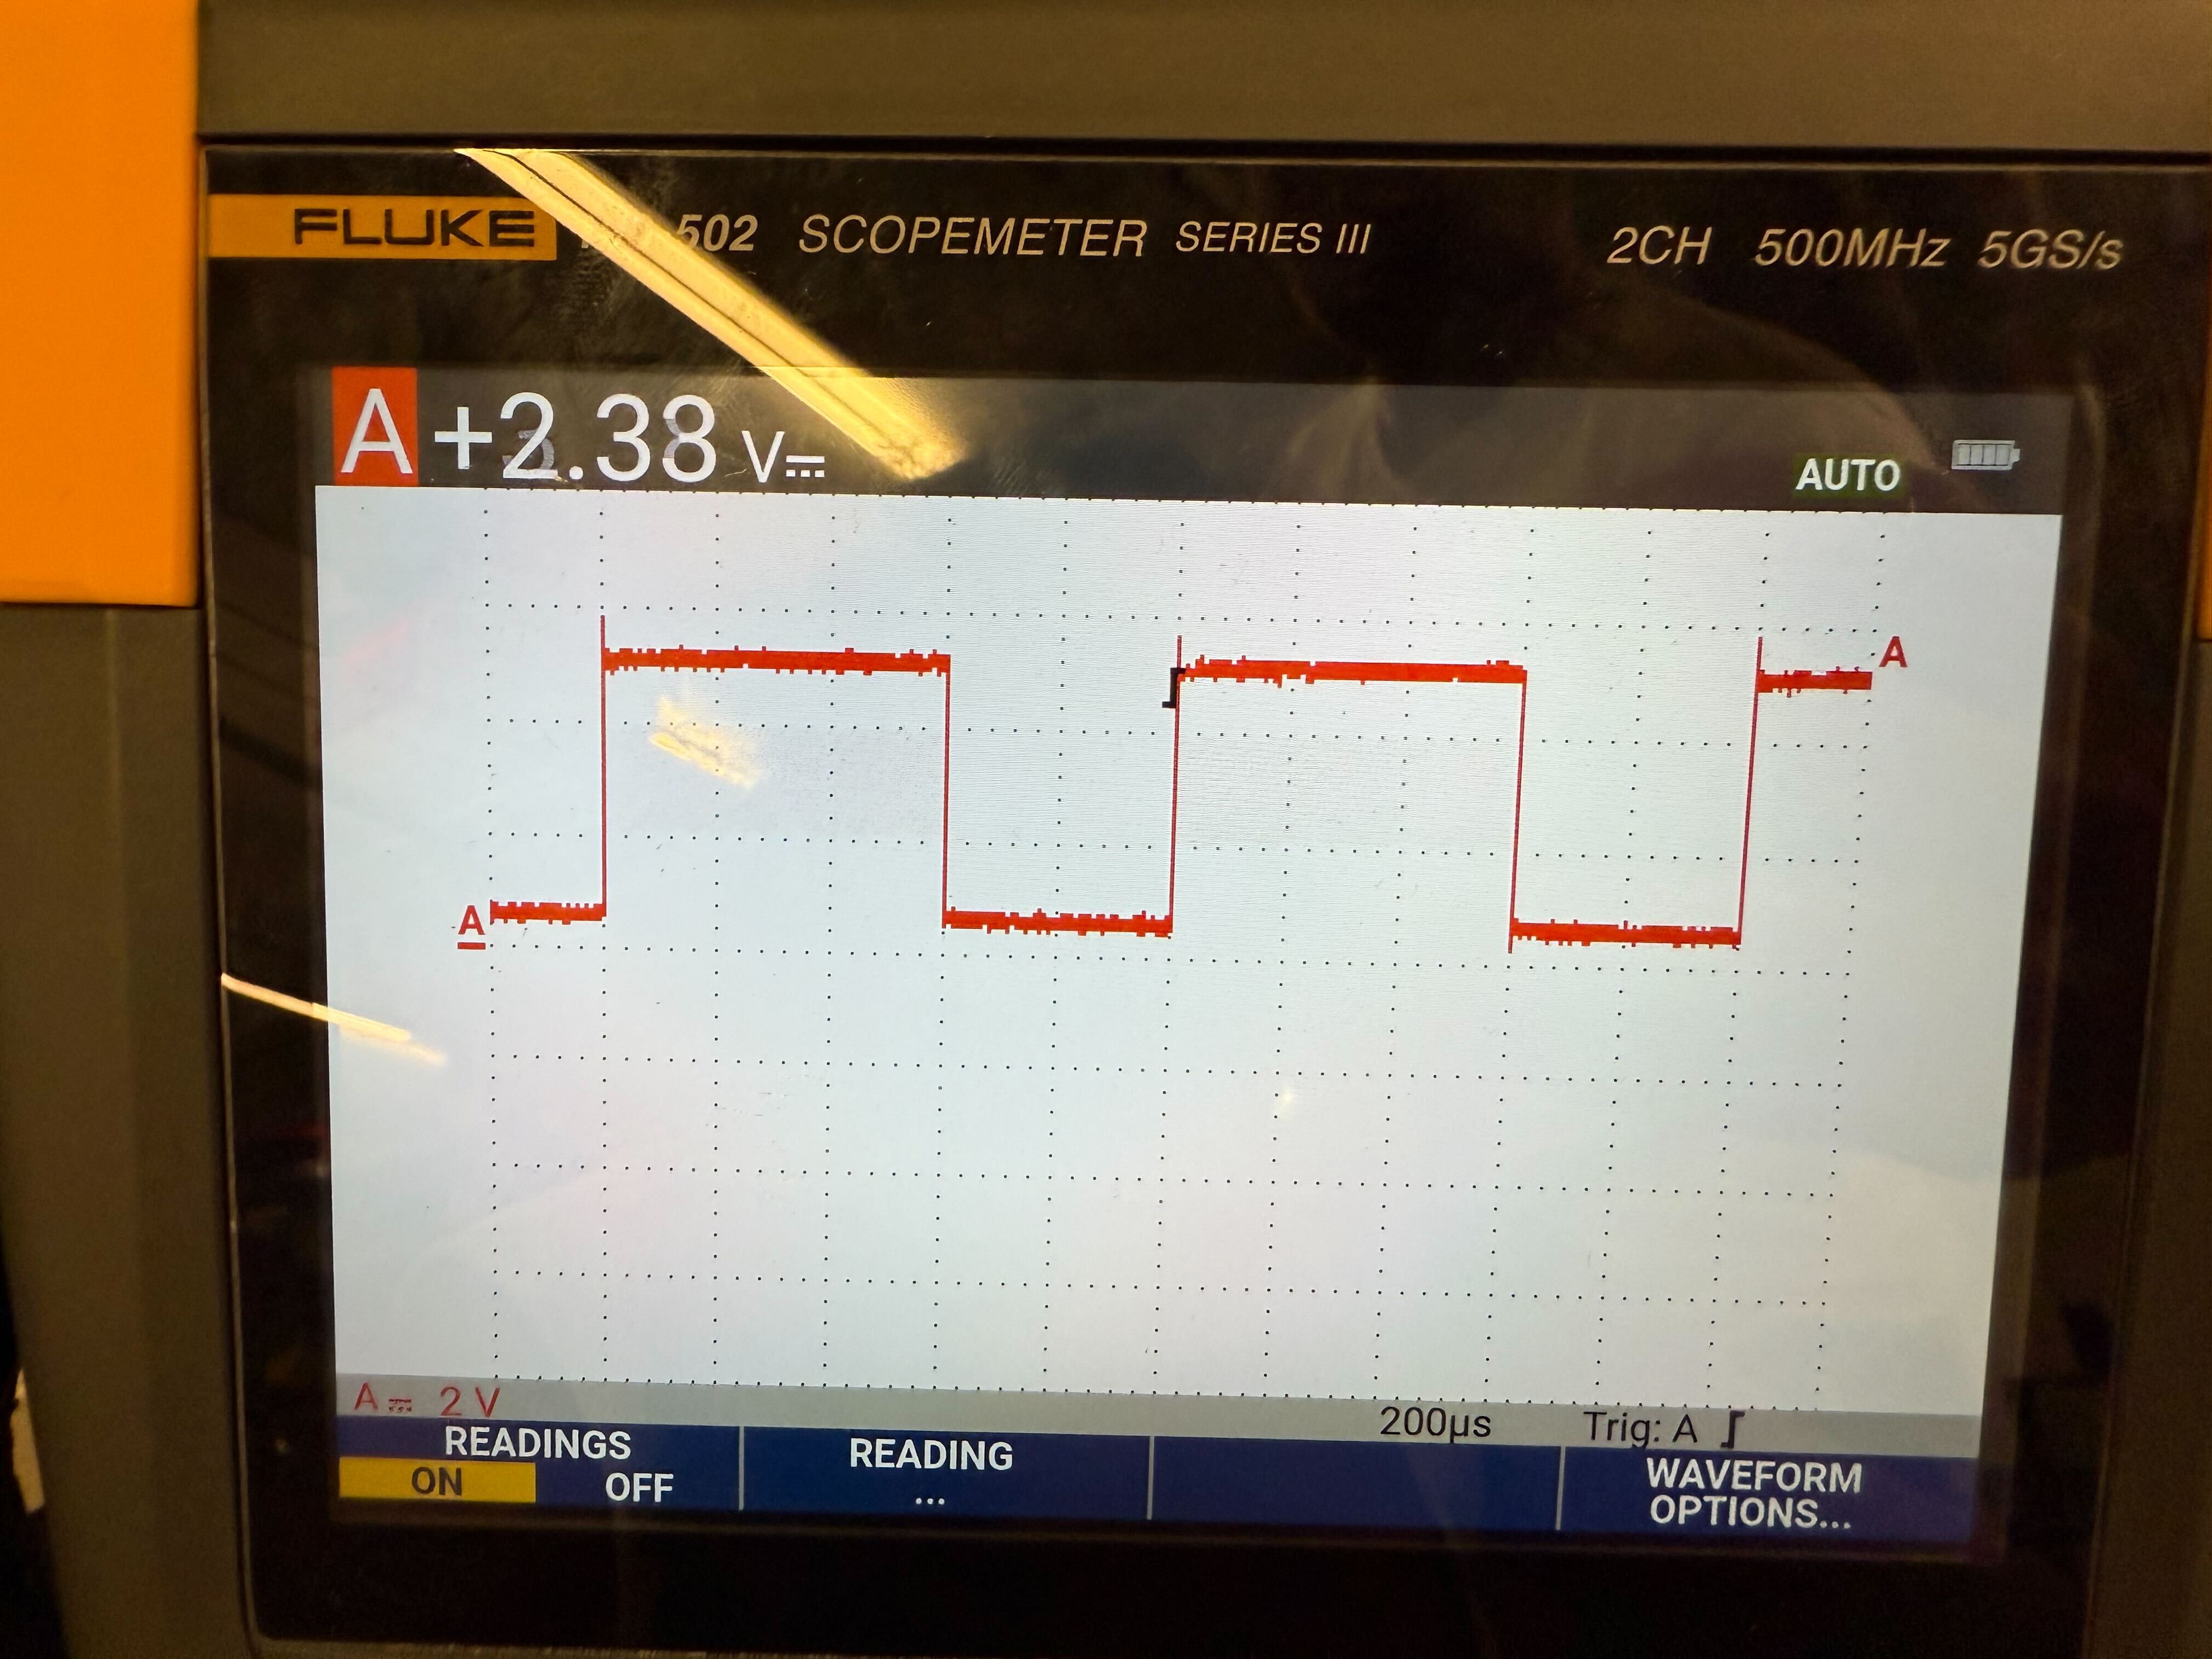
Additionally, we wanted to test that the fan received different PWM values, so below is a scope image of the PWM value of 2000. This verified that the different PWM signals propagated across the level shifter correctly, since the PWM output was significantly less, where the fan received the correct signal.
Initially, we believed our fans were able to run off of a 5V DC supply, but when testing our PWM, we noticed that the fan speed did not change as drastically as we expected. After careful reading of the datasheet, we found that this fan required a 12V supply. After changing the power supply, we saw the fans respond as expected, with visibly varying speeds as we changed the PWM signal.
Execution
We wanted to minimize the amount of power dissipated by our system, so in order to do so, we decided to deprioritize the speed at which we sampled the sensor data. For the current fill station architecture, we have a limited power budget, and this is not a flight-critical system. However, we implemented threads for our main polling loop, in order to create a baseline for concurrency in the future.
Accuracy
Our accuracy was measured by a comparison of PWM data, as mentioned in the first few paragraphs of this section. We expected an inverted relationship between the PWM signal sent and the fan speed, and our observations correlated with our expectations. This is due to the fact that our level shifter is also an inverter.
Safety
In order to ensure safety, in terms of the program crashing, we implemented a choosing algorithm for our sensor data. If all sensor reads are valid, we utilize an average of the three sensor readings. However, if one or two of the sensor readings are invalid, we utilize an average of the valid readings. This allows our controller to be functional as long as we have at least one valid sensor reading. Additionally, both the BME280 and AMG8833 drivers utilize primarily functions with boolean return types. This is because these functions implement safety checks wherever possible to ensure that the purpose of the function was successful and that a user will know whether it was successful or not. For example, whenever either driver performs an I2C write, it will read back the value at the address it wrote to and check whether this value matches with what was intended to be written. If so, the function returns true, otherwise, it will return false. This applies to other functionalities too, such as verifying sensor initialization by validating provided arguments and checking for the correct chip ID of the sensor.
Usability
Usability was an important consideration in our design, which is why we chose our interface to be an iOS app which anyone with an iPhone could download and use. The app strives to follow Apple’s human interface guidelines, so it would be familiar to anyone who has used iOS apps in the past.
Conclusions
Overall, we met most of our goals for our active cooling system. Our project enables us to easily and wirelessly monitor the temperature within the fill station electronics box, and maintain controlled temperature regulation through our fans as well. We also learned how to use Bluetooth functionality on both the Pico as well as the iPhone. Due to time and logistical difficulties, one part of our project that we did not get to was integrating the thermal camera. One thing we might have done differently was to focus on getting the Bluetooth infrastructure up and running much earlier in the project, as that was the big unknown for all of us going into it.
Conformance to Applicable Standards
Our project conforms to the Bluetooth Low Energy protocol.
Intellectual Property Considerations
The app code relied heavily on Apple’s own libraries, as is typical when building for Apple platforms. The Pico code also utilized files and structure from Hunter’s Bluetooth RP2040 Demo, as well as some temperature sensor driver code from Bosch. We also made use of another project on Cornell Rocketry, a Rocket Tracker app which also utilizes a Pico W to iPhone connection. We do not see any immediate patent opportunities for our project, as it is highly specialized to our specific use case for our rocket.
Appendices
Appendix A
The group approves this report for inclusion on the course website. The group approves the video for inclusion on the course YouTube channel.
Appendix B
All of our code is on our GitHub repository
Here is the datasheet for the logic level shifter, the 74AHCT125
Here is the datasheet for our PWM Fan
Here is the code for Cornell Rocketry's Rocket Tracker
BME280 Temperature Sensor
AMG8833 Thermal Camera