PiTunes
Abigail Varghese and Adele Thompson
Introduction
PiTunes turns Spotify music into light, allowing a user to see real-time FFT visuals or the album cover on an LED matrix.

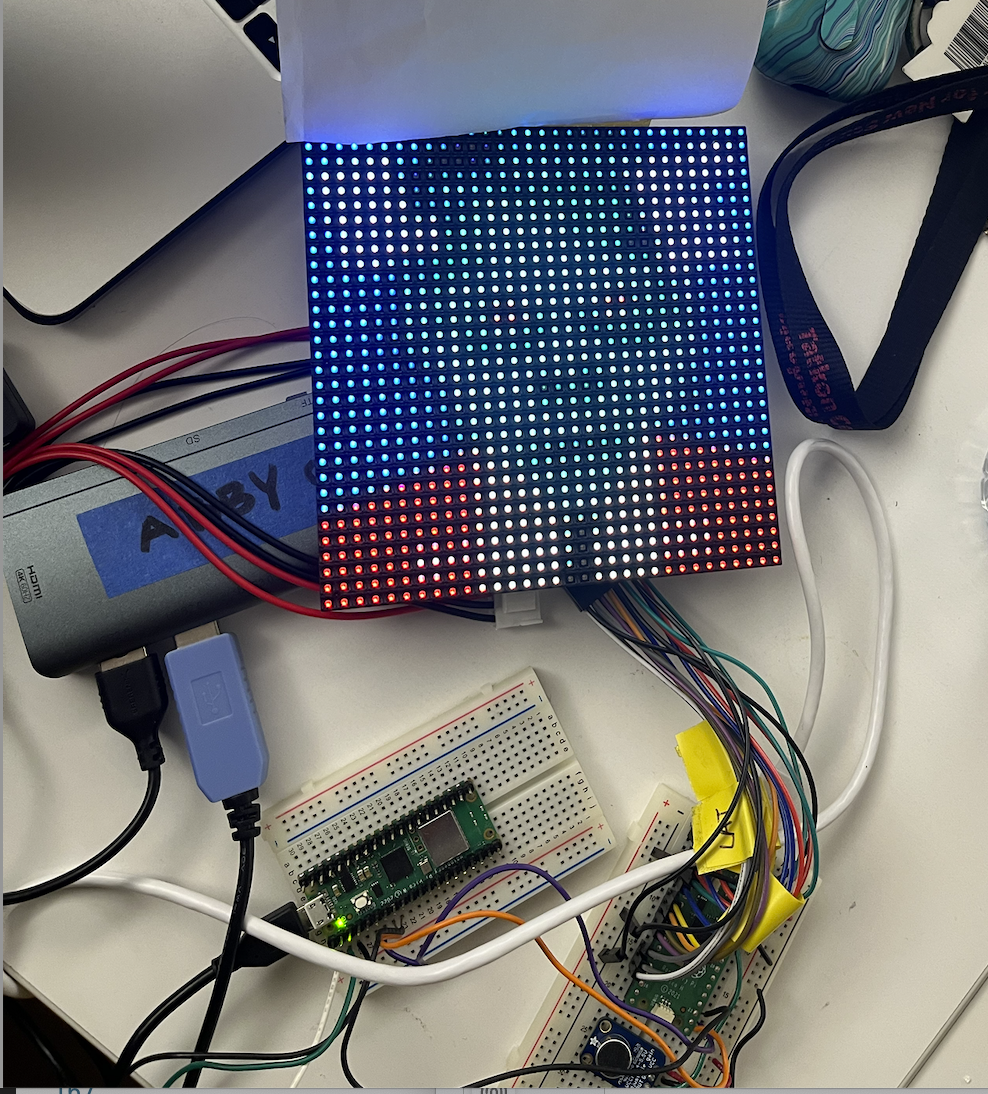
Figure 1: LED matrix lighting up album cover for "Heads Will Roll" By Yeah Yeah Yeahs, A-Track

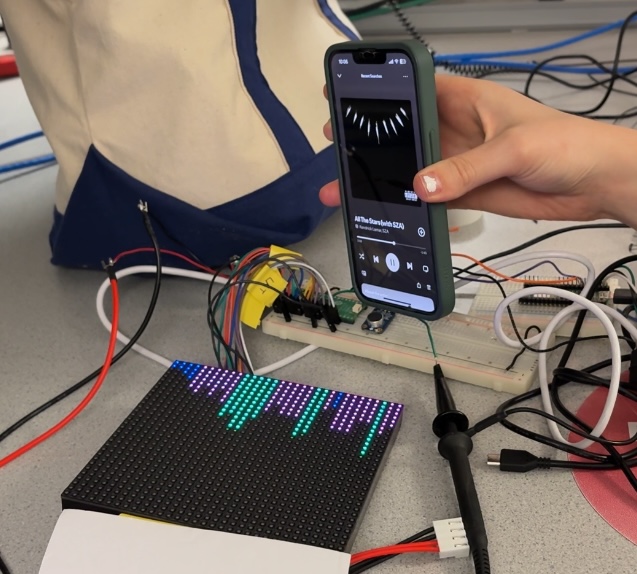
Figure 2: FFT of "All the Stars" by Kendrick Lamar and SZA
Summary
We designed PiTunes, a system that allows a user to visualize their Spotify music through lights using microcontrollers. This project combines a user's laptop, Raspberry Pi Pico, Pico W, and 32x32 RGB LED matrix to produce LED album cover visuals and live Fast Fourier Transform (FFT) based visuals. When PiTunes is in its FFT mode, it captures a user's audio through microphone input, performs a 1024 fixed-point FFT, and maps the calculations to LED bar heights and colors to be displayed on the LED matrix. When PiTunes is in its album cover mode, a user's laptop pulls the song they are currently listening to on Spotify using Spotify Web API, converts the image into a 32x32 pixel image, converts the pixels into RGB565, and communicates the pixel data using WiFi to the Pico W. The Pico W then acts as a transceiver to the Pico, and sends the pixel data using UART communication. The Pico then uses the pixel data collected to render the album cover image on the 32x32 LED matrix. The user can switch between FFT and album cover mode using a physical button. The main goal of this project was to make something personally meaningful between us, specifically the music that provided us with stability, friendship, and memories at Cornell, into something we could see and share with others.
Rationale
Spotify holds a special place in our hearts, especially during our time at Cornell. It was more than just a music platform, it became a way for us to bond beyond the classroom. What started out as listening to Spotify while working on lab reports or problem sets during office hours quickly turned into noticing common songs of interest and music recommendations. Beyond fostering conversations beyond the classroom, music proved to be a vital stress-coping mechanism, allowing us to navigate the highs and lows of life in college. Whether it was finding the perfect playlist to focus on assignments or studying for prelims, walking around campus, preparing for presentations, or even processing moments of grief and joy, music became an archive of our experiences and memories - arguably to a fault (as evident by Abigail's hundreds of playlists). For our final project, we were inspired by the idea of merging musical visualization with IoT-connected microcontrollers to create a Spotify visualizer to enhance the music listening experience by adding an interactive visual display. This visual display will allow users to see the audio they are listening to in an aesthetically pleasing and colorful way, enabling them to have a stronger emotional and sensory connection to their music, as colors are often associated with emotion or moods. Additionally, we hope to have our Spotify visualizer allow users to further appreciate the intent behind artists' album covers.
Background math
In our project, we used a 1024-point Fast Fourier Transform (FFT) to allow us to convert live audio data in the time domain to the frequency domain to allow a user to visualize audio they were listening to. For our FFT, we mainly used the FFT calculations from Professor Adams' FFT demo code provided in the Realtime Audio FFT to VGA Display demo. This demo utilizes fixed point calculations and -max min an approximation method to determine the magnitude of the FFT bin without using the computationally costly square root. The FFT calculation from the demo code results in 512 frequency bins. The sampling rate of the microphone was 10 kHz, thus each frequency bin is roughly 9.77 Hz. To display the FFT on our 32x32 RGB LED matrix, we had to determine how to map the results to bar heights and colors. To do so, we divided the 508 bins from the FFT calculations , avoiding the lower 4 bins as they contain pretty low frequencies that would contain non-audible noise, into 32 frequency bands, each containing a range of about 156 Hz.
Logical Structure
Our system has four key components that work together to provide a Spotify-enhanced visualizer experience: network communication, data transfer, signal processing, and visualization. These tasks are divided between our laptop and two microcontrollers, the Raspberry Pi Pico and the Raspberry Pi Pico-W. PiTune's first function is to be a live FFT-based visualizer by capturing audio input through a microphone, performing real-time frequency analysis on the RP2040 by performing a 1024-point fixed-point FFT, and then using that data to map to bar heights and colors to control the LED matrix using the HUB75 library. The LED matrix is refreshed at a fixed interval 50µs using a protothread. PiTune's second function is to act as an LED display of a song's album cover, pulling Spotify data from our laptop using Spotify's Web API Our laptop pulls initial data from Spotify API to be sent to the Pico-W to allow for the function of viewing album covers. On our laptop, many Python scripts were run locally using a simple website with buttons. The website was able to sign into a user's Spotify account, pick a song, and then return to the website to retrieve the song's currently playing data. While retrieving data using the “Download Album Cover of Current Song” button, the website also ran a script to download and resize the album cover to 32x32 pixels to match our 32x32 matrix. Additionally, the script converted the image into 16-bit RGB565 and saved it in a new header file. The button “Run UDP Send Script” was then used to run a script that was able to send the RGB565 data via UDP from the laptop to the Pico W. The Pico W receives this RGB565 data from the laptop using UDP, and then sends this data to the Pico using UART communication. Meanwhile, the Pico can receive the image data from the Pico W via UART and can control the LED matrix to render the image. To transmit the data on UDP and UART, the data must be split into two-byte pairs, and the transmission starts with a two-byte start marker and ends with a single-byte end marker.

Figure 3: Website to open spotify webplayer, download album cover,
and send the UDP script to the Pico W
Hardware & Software tradeoffs
For our FFT math and LED rendering, we continued to opt for the fixed-point calculations to improve performance on the Pico. We chose to use the Pico W due to its ability for its Wi-Fi capabilities, which would allow us to receive image data directly from what a user was currently listening to. Additionally, we chose to split our system between the Pico W and Pico to allow for faster image rendering on our LED matrix. Our laptop and Pico W were used to allow for fast communication of image data from Spotify using UDP, meanwhile, UART allowed for reliable communication between the Pico W and Pico.

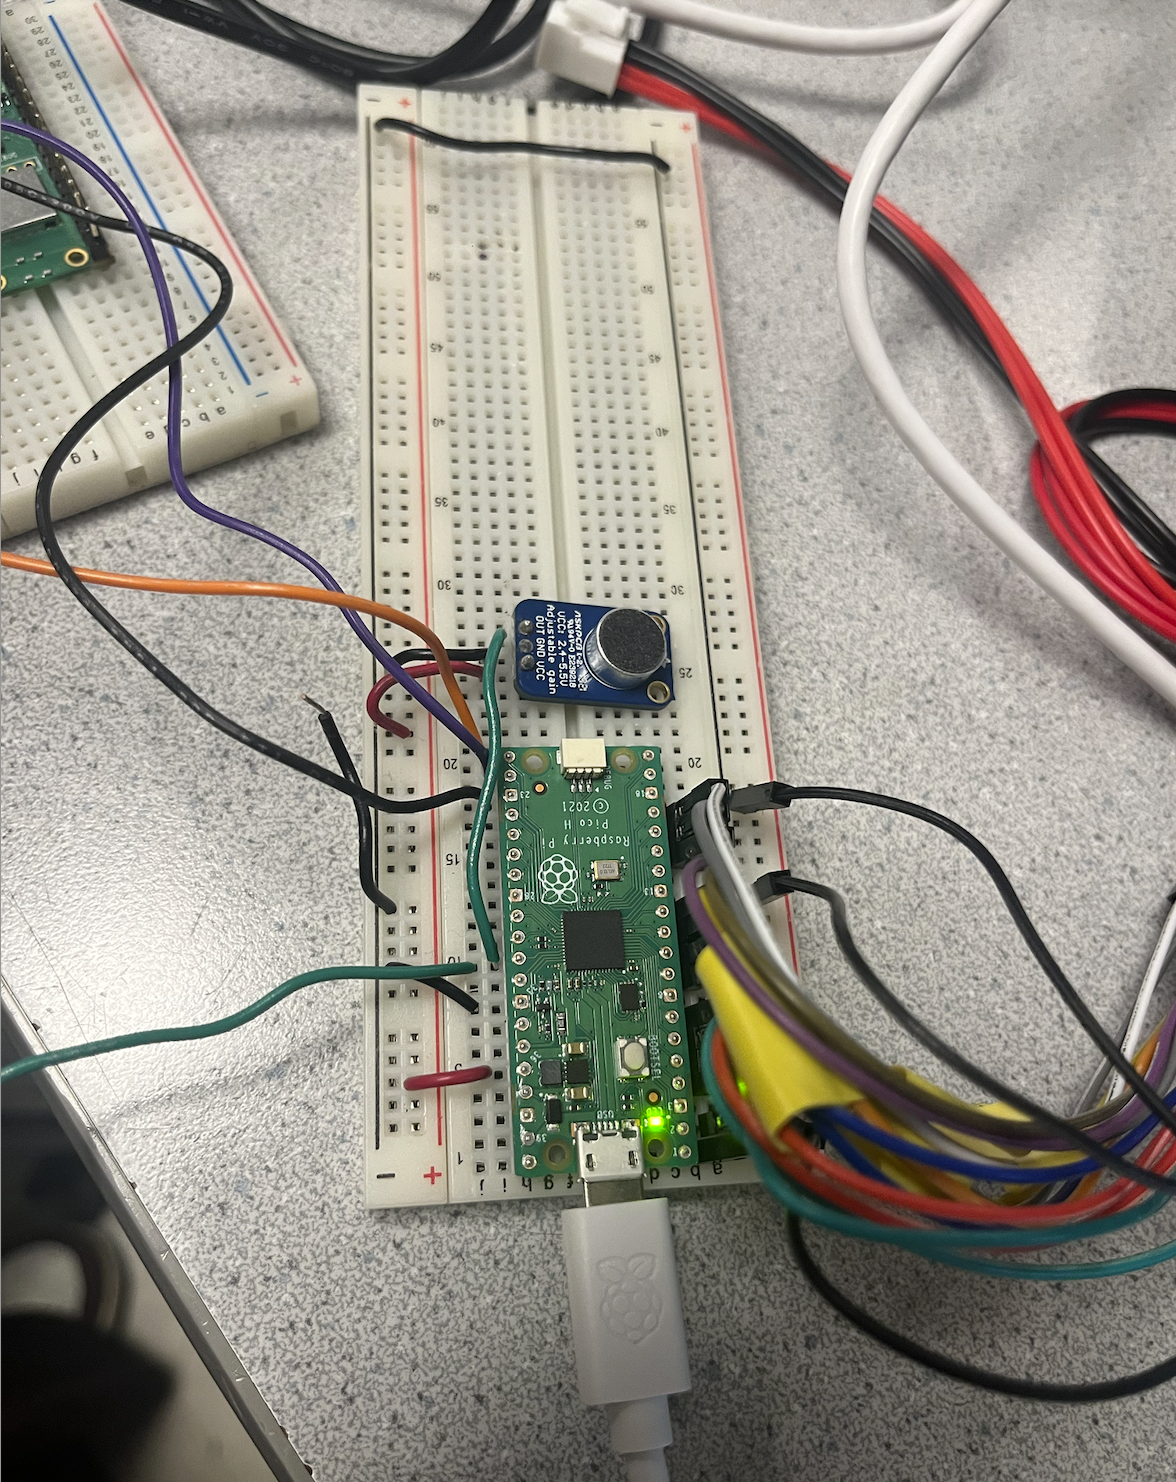
Figure 4: Hub75 and microphone wired to Rasberry Pi Pico
Existing patents, copyrights, trademarks
Our project utilizes Spotify API to get a user's listening data, such as the current song they are playing and album cover art. To use Spotify's Web Developer API, we had to follow Spotify's Developer Terms of Service, which allows us to use their API as this is a non-commercial, academic project, as we did not redistribute any copyrighted content.
Hardware Design
Our project consists of a Raspberry Pi Pico, Pico W, a 32x32 LED matrix, and a microphone. The connection from our laptop to the Pico W was a simple USB to USB connection. From the pico W to the pico, we used the UART connection wires, which include TX, RX, and ground. The TX of the picow would connect to the RX of the pico and vice versa. We then connected the LED matrix to the pico following the pico-example GitHub for the Hub75 example. This shows how to wire up the Pico to the pins of the Hub75. As for the microphone, we attached the signal line to GPIO 26, the power to the pico's power, and the ground to the pico’s ground.
Program Design
Pico W
Our Pico W handled Wi-Fi communication of our system, specifically pulling Spotify image data that was collected from
the laptop using UDP, and then sending that data to the Pico using UART. For both UDP and UART communication, the main
challenge we had was synchronization of data. Often if we would send the data in one go with either method, the
receiving microcontroller would miss the start of the data transmitted, leading to misaligned bytes and incorrect pixel
data to display. To help combat misaligned data, we relied on markers in messages and state flags. The image data
consisted of 2048 bytes of RGB565 pixel data, which was two bytes per pixel. To send the data reliably using UDP, the
data was sent as packets to send between our laptop and the Pico W. To ensure that data was sent reliably in order, we
also included start and end markers at the beginning and end of the data to be sent via UDP. Our Pico W code was
primarily based on Professor Adams’ UDP demo code from class. We modified the udpecho_raw_recv function ensure that when
data was received on the Pico W with UDP, the data was checked for the start marker, which we had as the bytes 0xAA and
0x55, to trigger the Pico W to be ready to receive image data. After being set to receive a new image with the start
marker, the image data was stored into the 2048 byte array image_buf. When the end marker, or 0xFF, was received, and
all 2048 bytes were detected, we used a flag called image_ready to trigger a semaphore and start the UART communication
thread.
To start the UART communication, or more specifically, to have the Pico W start acting as a UART transceiver, the similar 0xAA and 0x55 markers were used to flag the start of the message. The image data was then sent in two byte pairs; first sending the most significant byte, to follow the format of RGB565. After sending the 1024 byte pairs, a 0xFF end marker was sent. To further help ensure synchronization of data sent, we delayed UART transmission by 500 ms to allow for the receiving Pico time to catch up and avoid missing data at the start of a transmission.
Pico
Our normal Raspberry Pi Pico handled receiving image data from the Pico W using UART and controlling the LED matrix to
allow for FFT visualization or album cover display. To switch between the two modes, we implemented a button (GPIO 28)
that switched a global mode variable and was handled in the prothread_button.
Album Cover Display
When the button toggles to album cover mode (mode ==1), protothread_album_cover runs. Similar to UDP and UART
communication on the Pico W, while in album cover mode, the Pico waits for the start markers of 0xAA and 0x55 to start
storing image data. As mentioned earlier, when the image data was sent from the Pico W, it was sent as two byte pairs.
As the Pico received the byte pairs, it reconstructed the 16-bit RGB565 using (high << 8) | low , and then stored the
result into the array “received_image” to be used later to send directly to the LED matrix.A fter receiving all the
byte pairs and the end marked 0xFF, the image data is used to display on the LED matrix. Using the modified HUB75
demo code, we used the gamma_correct_565_888 function to convert from RGB565 to RGB888 to improve brightness and
color perception on the LED matrix. The corrected pixel data is then sent using the HUB75 LED matrix driver, which
uses PIO state machines to handle pixel color data while the other manages the row selection to light up the matrix.
Because we were using the HUB75 driver, we didn’t have to worry about precise signal timing. Our matrix has a
double-scan layout, meaning that two rows are updated at once, so our code sends two rows of the corrected pixel
data at a time.
FFT Display
In mode==0, or the FFT mode, protothread_fft was used to capture live audio input and display a live FFT visual on the
LED matrix. For implementing this mode, especially the math for the FFT and setting up the ADC, we primarily referred to
and used a portion of the FFT demo code provided by Professor Adams. Using the ADC on GPIO 26, we collected 10 kHz audio
samples. These samples were stored in a buffer of 1024 points, and when the buffer was full, a Hann window was applied
to set all of the imaginary values to 0. Next, the FFT calculation was performed using the FFTfix function, which used
fixed-point calculations to avoid using computationally heavy square roots and alpha-max beta-min approximations to
calculate the frequencies. The result of the FFT calculation from the demo code was 1024 points. To have the FFT visual
on our LED matrix be fairly accurate and more visually interesting to look at on our matrix, we divided the FFT output
into 32 frequency bins of approximately 156 Hz and only used the first 512 bins of the FFT result. It should also be
noted that we ignored some of the lower frequencies of the lower bin to reduce noise for inaudible input. For each of
the bins, the FFT magnitudes were averaged and normalized with the maximum magnitude seen in a frame. The normalized
results were then scaled to a 0-32 range, corresponding to the height or number of LEDs in a column of our matrix, to
determine the LED bar height.
Overall, some challenges we ran into were getting the album cover data to be properly received and displayed properly on the LED matrix. Similar to issues we had with UDP communication, the root problem was lack of synchronization between the transmitting Pico W and the receiving Pico and the fix was to include markers. Another challenging aspect was trying to break up the RGB565 image data to send and making sure to be careful to make sure that the data was reconstructed properly to be interpreted by the Pico to send to the LED matrix. Finally, we ran into challenges with integration between using the provided FFT demo and the HUB75 library that we used to drive the LED matrix. When we first started integrating the libraries, we would notice that our LED matrix would lose the ability to light properly, other than flickering. To combine the libraries, we ended up replacing the DMA method of sampling with ISR ISR-based sampling to get more control with timing, which is what we believe was the root cause behind the LED matrix flickering or struggling to light up simpler patterns.
Results
Conclusion
This project was important to us because of our love for music. Being able to display what we had planned out in the beginning and see it all the way through was great. If we had to do this again, we would include more automated processes like the album cover changing every time you change the song, without interacting as much with the website. We could also explore the idea of including a potentiometer to adjust the sound back on your laptop. The last idea we had considered was to adjust the colors of the FFT based on sound or mood. Overall, we accomplished what we had hoped. With the help of Professor Adams's demo code and some other sources listed below, we were able to put together our exciting project to help us visualize music differently.
Work Distribution
We worked together for the majority of the project but towards the last week Abigail focused more on communication through the pico W to the pico while Adele focused on website generation and the Spotify API.
Appendix A Permissions
The group approves this report for inclusion on the course website.
The group approves the video for inclusion on the course youtube channel.
References
- Spotify API: Spotify Web API Docs
- FFT Theory: Professor Hunter Adams - FFT Theory
- FFT Demo Explanation: RP2040 FFT to VGA Display
- FFT Demo Code: Hunter Adams RP2040 FFT Code
- UDP Demo Code: Hunter Adams RP2040 UDP Code
- HUB75 Example (Pico SDK): Raspberry Pi Pico HUB75 SDK Example
- Spotipi (Reference Idea): Spotipi GitHub (similar concept, not used directly)